
Probability and Statistics for Engineering and the Sciences
9th Edition
ISBN: 9781305251809
Author: Jay L. Devore
Publisher: Cengage Learning
expand_more
expand_more
format_list_bulleted
Videos
Textbook Question
thumb_up100%
Chapter 7.3, Problem 33E
The article “Measuring and Understanding the Aging of Kraft Insulating Paper in Power Transformers” (IEEE Electrical Insul. Mag., 1996: 28-34) contained the following observations on degree of polymerization for paper specimens for which viscosity times concentration fell in a certain middle
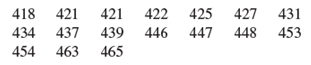
- a. Construct a boxplot of the data and comment on any interesting features.
- b. Is it plausible that the given sample observations were selected from a
normal distribution ? - c. Calculate a two-sided 95% confidence interval for true average degree of polymerization (as did the authors of the article). Does the interval suggest that 440 is a plausible value for true average degree of polymerization? What about 450?
Expert Solution & Answer

Trending nowThis is a popular solution!

Students have asked these similar questions
The yield of alfalfa from a random sample of six test plots is 1.4, 1.6, 0.9, 1.9, 2.2,and 1.2 tons per acre. Assume the data can be looked upon as a sample from anormal population. Test at the 0.05 level of significance whether this supports thecontention that the average yield for this kind of alfalfa is 1.5 tones per acre.
The article “Ozone for Removal of Acute Toxicity from Logyard Run-off” (M. Zenaitis and S. Duff, Ozone Science and Engineering, 2002: 83–90) presents chemical analyses of runoff water from sawmills in British Columbia. Included were measurements of pH for six water specimens: 5.9, 5.0, 6.5, 5.6, 5.9, 6.5. Assume that these are a random sample of water specimens from a normal population. a) Find a 98% prediction interval for a pH of a single specimen. b) Find a tolerance interval for the pH that includes 95% of the specimens with 95% confidence.
widely used as dielectrics and coolants in electrical systems in the past. They were found to be a major environmental contaminant in the 1960s. In a study, the mean PCB content at each of thirteen sites was reported for the years 1982 and 1996 (from “The ratio of DDE to PCB concentrations in Great Lakes herring gull eggs and its use in interpreting contaminants data”, Journal of Great Lakes Research 24 (1): 12-31, 1998). The data are below.Site:12345678910111213198261.4864.4745.5059.7058.8175.9671.5738.0630.5139.7029.7866.8963.93199613.9918.2611.2810.0221.0017.3628.207.3012.809.4112.6316.8322.74(a) Which test would be more appropriate in this case: a t-test for the difference between two population means, or a paired t-test? Why?(b) Do the data provide sufficient evidence to support the claim that the mean PCB level has decreased in the region? Be sure to check all assumptions, write the null and alternative hypotheses, calculate the appropriate test statistic, calculate the p-value,…
Chapter 7 Solutions
Probability and Statistics for Engineering and the Sciences
Ch. 7.1 - Consider a normal population distribution with the...Ch. 7.1 - Each of the following is a confidence interval for...Ch. 7.1 - Suppose that a random sample of 50 bottles of a...Ch. 7.1 - A CI is desired for the true average stray-load...Ch. 7.1 - Assume that the helium porosity (in percentage) of...Ch. 7.1 - On the basis of extensive tests, the yield point...Ch. 7.1 - By how much must the sample size n be increased if...Ch. 7.1 - Let 1 0, 2 0, with 1 + 2 = . Then P(z1X-/nz2)=1-...Ch. 7.1 - a. Under the same conditions as those leading to...Ch. 7.1 - A random sample of n = 15 heat pumps of a certain...
Ch. 7.1 - Consider the next 1000 95% CIs for that a...Ch. 7.2 - The following observations are lifetimes (days)...Ch. 7.2 - The article Gas Cooking. Kitchen Ventilation, and...Ch. 7.2 - The negative effects of ambient air pollution on...Ch. 7.2 - Determine the confidence level for each of the...Ch. 7.2 - The alternating current (AC) breakdown voltage of...Ch. 7.2 - Exercise 1.13 gave a sample of ultimate tensile...Ch. 7.2 - The U.S. Army commissioned a study to assess how...Ch. 7.2 - The article Limited Yield Estimation for Visual...Ch. 7.2 - TV advertising agencies face increasing challenges...Ch. 7.2 - In a sample of 1000 randomly selected consumers...Ch. 7.2 - The technology underlying hip replacements has...Ch. 7.2 - The Pew Forum on Religion and Public Life reported...Ch. 7.2 - A sample of 56 research cotton samples resulted in...Ch. 7.2 - The Pew Forum on Religion and Public Life reported...Ch. 7.2 - The superintendent of a large school district,...Ch. 7.2 - Reconsider the CI (7.10) for p, and focus on a...Ch. 7.3 - Determine the values of the following quantities:...Ch. 7.3 - Determine the t critical value(s) that will...Ch. 7.3 - Determine the t critical value for a two-sided...Ch. 7.3 - Determine the t critical value for a lower or an...Ch. 7.3 - According to the article Fatigue Testing of...Ch. 7.3 - The article Measuring and Understanding the Aging...Ch. 7.3 - A sample of 14 joint specimens of a particular...Ch. 7.3 - Silicone implant augmentation rhinoplasty is used...Ch. 7.3 - A normal probability plot of the n = 26...Ch. 7.3 - A study of the ability of individuals to walk in a...Ch. 7.3 - Ultra high performance concrete (UHPC) is a...Ch. 7.3 - Exercise 72 of Chapter 1 gave the following...Ch. 7.3 - Prob. 40ECh. 7.3 - A more extensive tabulation of t critical values...Ch. 7.4 - Determine the values of the following quantities:...Ch. 7.4 - Determine the following: a. The 95th percentile of...Ch. 7.4 - The amount of lateral expansion (mils) was...Ch. 7.4 - Wire electrical-discharge machining (WEDM) is a...Ch. 7.4 - Wire electrical-discharge machining (WEDM) is a...Ch. 7 - Example 1.11 introduced the accompanying...Ch. 7 - The article Distributions of Compressive Strength...Ch. 7 - For those of you who dont already know, dragon...Ch. 7 - A journal article reports that a sample of size 5...Ch. 7 - Unexplained respiratory symptoms reported by...Ch. 7 - High concentration of the toxic element arsenic is...Ch. 7 - Aphid infestation of fruit trees can be controlled...Ch. 7 - It is important that face masks used by...Ch. 7 - A manufacturer of college textbooks is interested...Ch. 7 - The accompanying data on crack initiation depth...Ch. 7 - In Example 6.8, we introduced the concept of a...Ch. 7 - Prob. 58SECh. 7 - Prob. 59SECh. 7 - Prob. 60SECh. 7 - Prob. 61SECh. 7 - Prob. 62SE
Knowledge Booster


Learn more about
Need a deep-dive on the concept behind this application? Look no further. Learn more about this topic, statistics and related others by exploring similar questions and additional content below.Similar questions
- Fiber Density. In the article “Comparison of Fiber Counting by TV Screen and Eyepieces of Phase Contrast Microscopy” (American Industrial Hygiene Association Journal, Vol. 63, pp. 756–761), I. Moa et al. reported on determining fiber density by two different methods. The fiber density of 10 samples with varying fiber density was obtained by using both an eyepiece method and a TV-screen method. A hypothesis test is to be performed to decide whether, on average, the eyepiece method gives a greater fiber density reading than the TV-screen method. a. identify the variable. b. identify the two populations. c. identify the pairs. d. identify the paired-difference variable. e. determine the null and alternative hypotheses. f. classify the hypothesis test as two tailed, left tailed, or right tailed.arrow_forwardThe article “Arsenic and Mercury in Lake Whitefish and Burbot Near the Abandoned Giant Mine on Great Slave Lake” (P. Cott, B. Zajdlik, et al., Journal of Great Lakes Research, 2016:223–232) presents measurements of arsenic concentrations in fish found in Northern Canada. In a sample of 8 whitefish caught in Yellowknife Bay, the mean arsenic concentration in the liver was 0.32 mg/kg, with a standard deviation of 0.05 mg/kg. Can you conclude that the mean arsenic concentration in whitefish in Yellowknife Bay is greater than 0.3 mg/kg?arrow_forward14. The accompanying data set consists of observationson shower-flow rate (L/min) for a sample of n 5 129houses in Perth, Australia (“An Application of BayesMethodology to the Analysis of Diary Records in aWater Use Study,” J. Amer. Stat. Assoc., 1987:705–711):4.6 12.3 7.1 7.0 4.0 9.2 6.7 6.9 11.5 5.111.2 10.5 14.3 8.0 8.8 6.4 5.1 5.6 9.6 7.57.5 6.2 5.8 2.3 3.4 10.4 9.8 6.6 3.7 6.48.3 6.5 7.6 9.3 9.2 7.3 5.0 6.3 13.8 6.25.4 4.8 7.5 6.0 6.9 10.8 7.5 6.6 5.0 3.37.6 3.9 11.9 2.2 15.0 7.2 6.1 15.3 18.9 7.25.4 5.5 4.3 9.0 12.7 11.3 7.4 5.0 3.5 8.28.4 7.3 10.3 11.9 6.0 5.6 9.5 9.3 10.4 9.75.1 6.7 10.2 6.2 8.4 7.0 4.8 5.6 10.5 14.610.8 15.5 7.5 6.4 3.4 5.5 6.6 5.9 15.0 9.67.8 7.0 6.9 4.1 3.6 11.9 3.7 5.7 6.8 11.39.3 9.6 10.4 9.3 6.9 9.8 9.1 10.6 4.5 6.28.3 3.2 4.9 5.0 6.0 8.2 6.3 3.8 6.0a. Construct a stem-and-leaf display of the data.b. What is a typical, or representative, flow rate?c. Does the display appear to be highly concentrated orspread out?d. Does the distribution of values appear…arrow_forward
- Fluoride Exposure in Drinking Water Exercise 2.250 introduces a study showing that fluoride exposure might have long-term negative consequences for the offspring of pregnant women. Part of the study examines the effect of adding fluoride to tap water on mean fluoride concentration in women. Summary statistics for fluoride concentration (measured in mg/L) for the two groups are given in the table below. Tap water Fluoridated Non-fluoridated Conclusion: Sample size 141 228 Mean 0.69 0.40 St.Dev. 0.42 0.27 Find and interpret a 99% confidence interval for the mean increase in fluoride concentration for those with fluoridated tap water. Let Group 1 represent those with fluoridated tap water and Group 2 represent those without fluoridated tap water. Confidence interval: i to i (round to three decimal places)arrow_forwardThe article “Arsenic and Mercury in Lake Whitefish and Burbot Near the Abandoned Giant Mine on Great Slave Lake” (P. Cott, B. Zajdlik, et al., Journal of Great Lakes Research, 2016:223–232) presents measurements of arsenic concentrations in fish found in Northern Canada. a) In a sample of 8 whitefish caught in Yellowknife Bay, the mean arsenic concentration in the liver was 0.32 mg/kg, with a standard deviation of 0.05 mg/kg. Find a 95% confidence interval for the concentration in whitefish found in Yellowknife Bay. b) In a sample of 8 whitefish caught in Baker Pond, the mean arsenic concentration in the liver was 0.55 mg/kg, with a standard deviation of 0.36 mg/kg. Should the Student’s t distribution be used to find a 95% confidence interval for the concentration in whitefish found in Baker Pond? If so, find the confidence interval. If not, explain why not.arrow_forwardThe article "Solid-Phase Chemical Fractionation of Selected Trace Metals in Some Northern Kentucky Soils" (A. Karathanasis and J. Pils, Soil and Sediment Contamination, 2005:293-308) presents pH measurements of soil specimens taken from three" different types of soils. The results in the following table are consistent with" means and standard deviations reported in the article. Soil Type pH Measurements Alluvium 6.53, 6.03, 6.75, 6.82, 6.24 Glacial 6.07, 6.07, 5.36, 5.57, 5.48, 5.27, 5.80, 5.03, 6.65 Till Residuum 6.03, 6.16, 6.63, 6.13, 6.05, 5.68, 6.25, 5.43, 6.46, 6.91, 5.75, 6.53 Construct an ANOVA table. You may give a range for the P-value. Can you conclude that there are differences among the mean pH levels? a. b.arrow_forward
- The degenerative disease osteoarthritis most frequently affects weight-bearing joints such as knee. The article “Evidence of Mechanical Load Redistribution at the Knee Joint in the Elderly when Ascending Stairs and Ramps” (Annals of Biomed. Engr., 2008:467-476) presented the following summary data on stance duration (ms) for samples of both older and younger adults. Age Sample Size Sample Mean Sample SD Older 28 801 117 Younger 16 780 72 Assume that both stance duration distributions are normal. Carry out a test of hypotheses at significance level .05 to decide whether true average stance duration is larger among elderly individuals than among younger individuals. (Population variances are not assumed equal.)arrow_forwardUrinary fluoride concentration (in parts per million) was measured for both a sample of livestock that had been grazing in an area previously exposed to fluoride pollution and a similar sample of livestock that had grazed in an unpolluted region. Do the accompanying data indicate strongly that the mean fluoride concentration for livestock grazing in the polluted region is larger than that for livestock grazing in the unpolluted region? Assume that the distributions of urinary fluoride concentration for both grazing areas have the same shape and spread. Use a significance level of 0.05. Group 1 (Polluted): 21.3 || 18.7 || 23.0 || 17.1 || 16.8 || 20.9 || 19.7 Group 2 (Unpolluted): 14.2 || 18.3 || 17.2 || 18.4 || 20.0 What is/are the Mann-Whitney Rank Sum critical value(s) for this problem? Select an answer and submit. For keyboard navigation, use the up/down arrow keys to select an answer. a 43 b 56 n 58,33 d 60arrow_forwardConsider the following sample of observations on coating thickness for low-viscosity paint (“Achieving a Target Value for a Manufacturing Process: A Case Study," J. Qual. Technol., 1992: 22-26): 0.83 0.88 0.88 1.04 1.09 1.12 1.29 1.31 1.48 1.49 1.59 1.62 1.65 1.71 1.76 1.83 Assume that the distribution of coating thickness is normal (a normal probability plot strongly supports this assumption) (d) Estimate Pr(X < 1.5), i.e., the proportion all thickness values less than 1.5. [Hint: If you knew the values of u and o, you could calculate this probability. These values are not available, but they can be estimated.]arrow_forward
- Consider the following sample of observations on coating thickness for low-viscosity paint (“Achieving a Target Value for a Manufacturing Process: A Case Study," J. Qual. Technol., 1992: 22-26): 0.83 0.88 0.88 1.04 1.09 1.12 1.29 1.31 1.48 1.49 1.59 1.62 1.65 1.71 1.76 1.83 Assume that the distribution of coating thickness is normal (a normal probability plot strongly supports this assumption) (a) Calculate a point estimate of the mean value of coating thickness, and state which estimator you used. (b) Calculate a point estimate of the median of the coating thickness distribution, and state which estimator you used. (c) Calculate a point estimate of the value that separates the largest 10% of all values in the thickness distribution from the remaining 90%, and state which estimator you used. [Hint: Express what you are trying to estimate in terms of u and o] (d) Estimate Pr(X < 1.5), i.e., the proportion all thickness values less than 1.5. [Hint: If you knew the values of u and o, you…arrow_forwardThe article "A Probabilistic Analysis of Dissolved Oxygen-Biochemical Oxygen Demand Relationship in Streams" (J. Water Resources Control Fed., 1969: 73-90) reported data on the rate of oxygenation in streams in a certain region. The sample mean and standard deviation were computed as = 0.173 and s= 0.066, respectively. We would like to know if a normal distribution could be a reasonable model for the data. To do this, we have partitioned the quantitative variable into 5 discrete regions and counted the number of streams observed to have oxygenation rates in the given interval. First determine the probability of falling into each region if the normal distribution is the appropriate model. Then use those probabilities with the expected counts to conduct a Chi-squared goodness of fit test. Use a = 0.05. Frequency 12 20 23 15 13 Rate (per day) Below .100 .100 below.150 .150 - below.200 .200 - below .250 .250 or morearrow_forward1. A study compared the number of tree species in unlogged forest plots to similar plots logged 8 years earlier. Independent random samples of both logged and unlogged plots were analyzed and the number of tree species was recorded. Tables 1 and 2 present the Shapiro-Wilk normality test for both types of forest plots and the Independent Samples t-test results. Use the information presented in these tables to answer the questions. Table 1: Tests of Normality Tests of Normality Kolmogorov-Smirnov Shapiro-Wilk Forest Plot Statistic df Sig. Statistic df Sig. Tree_Species Logged .181 12 .200 .936 12 .444 Unlogged .110 14 .200 .945 14 .480 *. This is a lower bound of the true significance. a. Lilliefors Significance Correction Table 2: Independent Samples Test Independent Samples Test Levene's Test for Equality of Variances t-test for Equality of Means 95% Confidence Interval of the Difference Mean Std. Error F Sig. t df Sig. (2-tailed) Difference Difference Lower Upper Equal variances…arrow_forward
arrow_back_ios
SEE MORE QUESTIONS
arrow_forward_ios
Recommended textbooks for you
 MATLAB: An Introduction with ApplicationsStatisticsISBN:9781119256830Author:Amos GilatPublisher:John Wiley & Sons Inc
 Probability and Statistics for Engineering and th...StatisticsISBN:9781305251809Author:Jay L. DevorePublisher:Cengage Learning
 Statistics for The Behavioral Sciences (MindTap C...StatisticsISBN:9781305504912Author:Frederick J Gravetter, Larry B. WallnauPublisher:Cengage Learning
 Elementary Statistics: Picturing the World (7th E...StatisticsISBN:9780134683416Author:Ron Larson, Betsy FarberPublisher:PEARSON
 The Basic Practice of StatisticsStatisticsISBN:9781319042578Author:David S. Moore, William I. Notz, Michael A. FlignerPublisher:W. H. Freeman
 Introduction to the Practice of StatisticsStatisticsISBN:9781319013387Author:David S. Moore, George P. McCabe, Bruce A. CraigPublisher:W. H. Freeman
MATLAB: An Introduction with Applications
Statistics
ISBN:9781119256830
Author:Amos Gilat
Publisher:John Wiley & Sons Inc
Probability and Statistics for Engineering and th...
Statistics
ISBN:9781305251809
Author:Jay L. Devore
Publisher:Cengage Learning
Statistics for The Behavioral Sciences (MindTap C...
Statistics
ISBN:9781305504912
Author:Frederick J Gravetter, Larry B. Wallnau
Publisher:Cengage Learning
Elementary Statistics: Picturing the World (7th E...
Statistics
ISBN:9780134683416
Author:Ron Larson, Betsy Farber
Publisher:PEARSON
The Basic Practice of Statistics
Statistics
ISBN:9781319042578
Author:David S. Moore, William I. Notz, Michael A. Fligner
Publisher:W. H. Freeman
Introduction to the Practice of Statistics
Statistics
ISBN:9781319013387
Author:David S. Moore, George P. McCabe, Bruce A. Craig
Publisher:W. H. Freeman
Hypothesis Testing using Confidence Interval Approach; Author: BUM2413 Applied Statistics UMP;https://www.youtube.com/watch?v=Hq1l3e9pLyY;License: Standard YouTube License, CC-BY
Hypothesis Testing - Difference of Two Means - Student's -Distribution & Normal Distribution; Author: The Organic Chemistry Tutor;https://www.youtube.com/watch?v=UcZwyzwWU7o;License: Standard Youtube License