
Probability and Statistics for Engineering and the Sciences
9th Edition
ISBN: 9781305251809
Author: Jay L. Devore
Publisher: Cengage Learning
expand_more
expand_more
format_list_bulleted
Concept explainers
Videos
Textbook Question
Chapter 7.2, Problem 18E
The U.S. Army commissioned a study to assess how deeply a bullet penetrates ceramic body armor (“Testing Body Armor Materials for Use by the U.S. Army-Phase III,” 2012). In the standard test, a cylindrical clay model is layered under the armor vest. A projectile is then fired, causing an indentation in the clay. The deepest impression in the clay is measured as an indication of survivability of someone wearing the armor. Here is data from one testing organization under particular experimental conditions; measurements (in mm) were made using a manually controlled digital caliper:
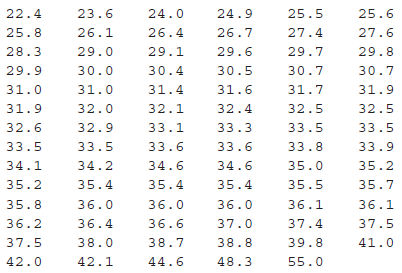
- a. Construct a boxplot of the data and comment on interesting features.
- b. Construct a normal
probability plot. Is it plausible that impression depth isnormally distributed ? Is a normal distribution assumption needed in order to calculate a confidence interval or bound for the true average depth μ using the foregoing data? Explain. Use the accompanying Minitab output as a basis for calculating and interpreting an upper confidence bound for μ with a confidence level of 99%.
| Variable | Count | Mean | SE Mean | StDev |
| Depth | 83 | 33.370 | 0.578 | 5.268 |
| Q1 | Q3 | IQR | |
| 30.400 | 33.500 | 36.000 | 5.600 |
Expert Solution & Answer

Trending nowThis is a popular solution!

Students have asked these similar questions
One operation of a mill is to cut pieces of steel into parts that will later be used as the frame for front seats in an automobile. The steel is cut with a diamond saw and requires the resulting parts to be
within 10.005 inch of the length specified by the automobile company. Data are collected from a sample of 50 steel parts and are shown in the following table. The measurement reported is the
difference in inches between the actual length of the steel part, as measured by a laser measurement device, and the specified length of the steel part. For example, the first value, -0.003,
represents a steel part that is 0.003 inch shorter than the specified length. Complete parts a through c
Click the icon to view the data table.
a. Construct a frequency distribution
Difference in Length
-0.005 but less than -0.003:
-0.003but less than -0.001
-0.001but less than 0.001
0.001but less than 0.003
0.003but less than 0.005
Frequency
Difference Between Actual and Specified Lengths
0.002
0
-0.003…
An ecologist hypothesizes that birds with longer wing spans use wider tree branches. The ecologist captured male birds, measured their wing span and other characteristics in millimeters, and then marked and released them. During the ensuing winter, the ecologist repeatedly observed the marked birds as they foraged for food on tree branches. He noted the branch diameter on each occasion, and calculated the average branch diameter for each bird in centimeters. The measurement data are below. What can the ecologist conclude with an α of 0.05
wing span
branch diameter
79.380.180.781.579.580.781.180.580.7
1.561.531.391.041.391.021.211.311.21
A) What is the appropriate statistic? Then Compute the statistic
B) Compute the appropriate test statistic(s) for H1: ρ > 0
critical value =
test statistic=
C) Effect Size
A researcher wonders whether younger mothers have babies that are significantly heavier or
lighter than the population average of μ 7.25 pounds. The researcher collects data from N
= 35 babies who were born to mothers between the ages of 16 and 18. The average weight
for these babies was M = 7.15 pounds (SD = .6 pounds).
Chapter 7 Solutions
Probability and Statistics for Engineering and the Sciences
Ch. 7.1 - Consider a normal population distribution with the...Ch. 7.1 - Each of the following is a confidence interval for...Ch. 7.1 - Suppose that a random sample of 50 bottles of a...Ch. 7.1 - A CI is desired for the true average stray-load...Ch. 7.1 - Assume that the helium porosity (in percentage) of...Ch. 7.1 - On the basis of extensive tests, the yield point...Ch. 7.1 - By how much must the sample size n be increased if...Ch. 7.1 - Let 1 0, 2 0, with 1 + 2 = . Then P(z1X-/nz2)=1-...Ch. 7.1 - a. Under the same conditions as those leading to...Ch. 7.1 - A random sample of n = 15 heat pumps of a certain...
Ch. 7.1 - Consider the next 1000 95% CIs for that a...Ch. 7.2 - The following observations are lifetimes (days)...Ch. 7.2 - The article Gas Cooking. Kitchen Ventilation, and...Ch. 7.2 - The negative effects of ambient air pollution on...Ch. 7.2 - Determine the confidence level for each of the...Ch. 7.2 - The alternating current (AC) breakdown voltage of...Ch. 7.2 - Exercise 1.13 gave a sample of ultimate tensile...Ch. 7.2 - The U.S. Army commissioned a study to assess how...Ch. 7.2 - The article Limited Yield Estimation for Visual...Ch. 7.2 - TV advertising agencies face increasing challenges...Ch. 7.2 - In a sample of 1000 randomly selected consumers...Ch. 7.2 - The technology underlying hip replacements has...Ch. 7.2 - The Pew Forum on Religion and Public Life reported...Ch. 7.2 - A sample of 56 research cotton samples resulted in...Ch. 7.2 - The Pew Forum on Religion and Public Life reported...Ch. 7.2 - The superintendent of a large school district,...Ch. 7.2 - Reconsider the CI (7.10) for p, and focus on a...Ch. 7.3 - Determine the values of the following quantities:...Ch. 7.3 - Determine the t critical value(s) that will...Ch. 7.3 - Determine the t critical value for a two-sided...Ch. 7.3 - Determine the t critical value for a lower or an...Ch. 7.3 - According to the article Fatigue Testing of...Ch. 7.3 - The article Measuring and Understanding the Aging...Ch. 7.3 - A sample of 14 joint specimens of a particular...Ch. 7.3 - Silicone implant augmentation rhinoplasty is used...Ch. 7.3 - A normal probability plot of the n = 26...Ch. 7.3 - A study of the ability of individuals to walk in a...Ch. 7.3 - Ultra high performance concrete (UHPC) is a...Ch. 7.3 - Exercise 72 of Chapter 1 gave the following...Ch. 7.3 - Prob. 40ECh. 7.3 - A more extensive tabulation of t critical values...Ch. 7.4 - Determine the values of the following quantities:...Ch. 7.4 - Determine the following: a. The 95th percentile of...Ch. 7.4 - The amount of lateral expansion (mils) was...Ch. 7.4 - Wire electrical-discharge machining (WEDM) is a...Ch. 7.4 - Wire electrical-discharge machining (WEDM) is a...Ch. 7 - Example 1.11 introduced the accompanying...Ch. 7 - The article Distributions of Compressive Strength...Ch. 7 - For those of you who dont already know, dragon...Ch. 7 - A journal article reports that a sample of size 5...Ch. 7 - Unexplained respiratory symptoms reported by...Ch. 7 - High concentration of the toxic element arsenic is...Ch. 7 - Aphid infestation of fruit trees can be controlled...Ch. 7 - It is important that face masks used by...Ch. 7 - A manufacturer of college textbooks is interested...Ch. 7 - The accompanying data on crack initiation depth...Ch. 7 - In Example 6.8, we introduced the concept of a...Ch. 7 - Prob. 58SECh. 7 - Prob. 59SECh. 7 - Prob. 60SECh. 7 - Prob. 61SECh. 7 - Prob. 62SE
Knowledge Booster


Learn more about
Need a deep-dive on the concept behind this application? Look no further. Learn more about this topic, statistics and related others by exploring similar questions and additional content below.Similar questions
- The "spring-like effect" in a golf club could be determined by measuring the coefficient of restitution (the ratio of the outbound velocity to the inbound velocity of a golf ball fired at the clubhead). Twelve randomly selected drivers produced by two clubmakers are tested and the coefficient of restitution measured. The data follow: Club 1: 0.8406, 0.8104, 0.8234, 0.8198, 0.8235, 0.8562, 0.8123, 0.7976, 0.8184, 0.8265, 0.7773, 0.7871 Club 2: 0.8305, 0.7905, 0.8352, 0.8380, 0.8145, 0.8465, 0.8244, 0.8014, 0.8309, 0.8405, 0.8256, 0.8476 Test the hypothesis that both brands of ball have equal mean overall distance. Use α = 0.05 and assume equal variances. Question: Reject H0 if t0 < ___ or if t0 > ___.arrow_forwardAn ecologist hypothesizes a relationship between wing span of birds and the width of tree branches they use. The ecologist captured male birds, measured their wing span and other characteristics in millimeters, and then marked and released them. During the ensuing winter, the ecologist repeatedly observed the marked birds as they foraged for food on tree branches. He noted the branch diameter on each occasion, and calculated the average branch diameter for each bird in centimeters. The measurement data are below. What can the ecologist conclude with an a of 0.10? wing span branch diameter 79.3 80.1 80.7 81.5 79.5 80.7 81.1 80.5 80.7 1.02 1.04 1.21 1.15 1.21 1.56 1.39 1.31 1.39 a) What is the appropriate statistic? Select- Compute the statistic selected in a): b) Obtain/compute the appropriate values to make a decision about Ho- Critical Value - ; Test Statistic= Decision: -Select- c) Compute the corresponding effect size(s) and indicate magnitude(s). If not appropriate, input and/or…arrow_forwardThe quality control engineer at Palmer Industries is interested in estimating the tensile strength of steel wire based on its outside diameter and the amount of molybdenum in the steel. As an experiment, she selected 25 pieces of wire, measured the outside diameters, and determined the molybdenum content. Then she measured the tensile strength of each piece. The results of the first four are recorded in the table. Tensile Strength Outside Diameter Amount of Molybdenum Place (PSI ) Y (mm) X1 (Units) X2 A 11 0.3 6 B 9 0.2 5 C 16 0.4 8 D 12 0.3 7 Using a statistical software package, the QC engineer determined the multiple regression equation to be Y’=-0.5+20X1+1X2. a) Based on the equation, what is the estimated tensile strength of a steel wire having an outside diameter of .35 mm and 6.4 units of molybdenum? b) Interpret the value of b1 in the equation.arrow_forward
- The toco toucan, the largest member of the toucan family, possesses the largest beak relative to body size of all birds. This exaggerated feature has received various interpretations, such as being a refined adaptation for feeding. However, the large surface area may also be an important mechanism for radiating heat (and hence cooling the bird) as outdoor temperature increases. Presented is the data for beak heat loss, as a percent of total body heat loss from all sources, at various temperatures in degrees Celsius. [Note: The numerical values in this problem have been modified for testing purposes.] Temperature (°C) 1515 1616 1717 1818 1919 2020 2121 2222 2323 2424 2525 2626 2727 2828 2929 3030 Percent heat loss from beak 3232 3636 3636 3333 3535 4747 5757 5151 4242 5353 4646 5252 5959 5959 6363 6262 (a) What is the equation of the least‑squares regression line for predicting beak heat loss, as a percent of total body heat loss from all sources, from temperature? (Use…arrow_forwardAn engineer wants to compare the tensile strengths of steel bars that are produced using a conventional method and an experimental method. (The tensile strength of a metal is a measure of its ability to resist tearing when pulled lengthwise.) To do so, the engineer randomly selectoarrow_forwardTo assess the strength of the recycled concrete aggregated products, the measurements of the resiliency modulus (MPa) were collected on 20 selected specimens. Identify the unit, population of units, variable of interest, statistical population, and sample.arrow_forward
- The table below shows head injury measurements from car crash dummies. The measurements are in head injury criterion unitsarrow_forwardShortleaf Pines. The ability to estimate the volume of a tree based on a simple measurement, such as the diameter of the tree, is important to the lumber industry, ecologists, and conservationists. Data on volume, in cubic feet, and diameter at breast height, in inches, for 70 shortleaf pines was reported in C. Bruce and F. X. Schumacher’s Forest Mensuration (New York: McGraw-Hill, 1935) and analyzed by A. C. Akinson in the article “Transforming Both Sides of a Tree” (The American Statistician, Vol. 48, pp. 307–312). The data are provided on the WeissStats site. a. obtain and interpret the standard error of the estimate. b. obtain a residual plot and a normal probability plot of the residuals. c. decide whether you can reasonably consider Assumptions 1–3 for regression inferences met by the two variables under consideration.arrow_forwardTo investigate water quality, the Columbus Dispatch took water specimens at 16 Ohio State Park swimming areas in central Ohio. Those specimens were taken to laboratories and tested for E. coli, which are bacteria that can cause serious gastrointestinal problems. For reference, if a 100-milliliter specimen (about 3.3 ounces) of water contains more than 130 E. coli bacteria, it is considered unsafe. The E. coli levels per 100 milliliters found by the laboratories are presented in the table: 291.0 10.9 47.0 86.0 44.0 18.9 1.0 50.0 190.4 45.7 28.5 18.9 16.0 34.0 8.6 9.6 To access the complete data set, click the link for your preferred software format: Excel Minitab JMP SPSS TI R Mac-TXT PC-TXT CSV CrunchIt! Find the mean E. coli level. Mean E.coli level (rounded to two decimal places) per 100 mlarrow_forward
- your car is more crowded than you think. table 5.8 reports results from a 1969 personal transportation survey on "home-to-work" trips in metropolitan areas. show that the average number of riders in the car of a typical commuter is 1.9.arrow_forwardThe toco toucan, the largest member of the toucan family, possesses the largest beak relative to body size of all birds. This exaggerated feature has received various interpretations, such as being a refined adaptation for feeding. However, the large surface area may also be an important mechanism for radiating heat (and hence cooling the bird) as outdoor temperature increases. The table contains data for beak heat loss, as a percentage of total body heat loss from all sources, at various temperatures in degrees Celsius. The data show that beak heat loss is higher at higher temperatures and that the relationship is roughly linear. [Note: The numerical values in this problem have been modified for testing purposes.] Temperature (Co) Percent heat loss from beak 15 32 16 34 17 35 18 33 19 37 20 46 21 55 22 51 23 43 24 52 25 45 26 53 27 58 28 60 29 62 30 62 Adapted from a graph in Glenn J. Tattersall et al., "Heat exchange from the toucan bill…arrow_forwardThe toco toucan, the largest member of the toucan family, possesses the largest beak relative to body size of all birds. This exaggerated feature has received various interpretations, such as being a refined adaptation for feeding. However, the large surface area may also be an important mechanism for radiating heat (and hence cooling the bird) as outdoor temperature increases. The table contains data for beak heat loss, as a percentage of total body heat loss from all sources, at various temperatures in degrees Celsius. The data show that beak heat loss is higher at higher temperatures and that the relationship is roughly linear. [Note: The numerical values in this problem have been modified for testing purposes.] Temperature (oC)(oC) Percent heat loss from beak 1515 3434 1616 3535 1717 3333 1818 3333 1919 3535 2020 4848 2121 5454 2222 5252 2323 4545 2424 5050 2525 4444 2626 5454 2727 5959 2828 6262 2929 6464 3030 6161 Adapted from a graph in…arrow_forward
arrow_back_ios
SEE MORE QUESTIONS
arrow_forward_ios
Recommended textbooks for you
 MATLAB: An Introduction with ApplicationsStatisticsISBN:9781119256830Author:Amos GilatPublisher:John Wiley & Sons Inc
 Probability and Statistics for Engineering and th...StatisticsISBN:9781305251809Author:Jay L. DevorePublisher:Cengage Learning
 Statistics for The Behavioral Sciences (MindTap C...StatisticsISBN:9781305504912Author:Frederick J Gravetter, Larry B. WallnauPublisher:Cengage Learning
 Elementary Statistics: Picturing the World (7th E...StatisticsISBN:9780134683416Author:Ron Larson, Betsy FarberPublisher:PEARSON
 The Basic Practice of StatisticsStatisticsISBN:9781319042578Author:David S. Moore, William I. Notz, Michael A. FlignerPublisher:W. H. Freeman
 Introduction to the Practice of StatisticsStatisticsISBN:9781319013387Author:David S. Moore, George P. McCabe, Bruce A. CraigPublisher:W. H. Freeman
MATLAB: An Introduction with Applications
Statistics
ISBN:9781119256830
Author:Amos Gilat
Publisher:John Wiley & Sons Inc
Probability and Statistics for Engineering and th...
Statistics
ISBN:9781305251809
Author:Jay L. Devore
Publisher:Cengage Learning
Statistics for The Behavioral Sciences (MindTap C...
Statistics
ISBN:9781305504912
Author:Frederick J Gravetter, Larry B. Wallnau
Publisher:Cengage Learning
Elementary Statistics: Picturing the World (7th E...
Statistics
ISBN:9780134683416
Author:Ron Larson, Betsy Farber
Publisher:PEARSON
The Basic Practice of Statistics
Statistics
ISBN:9781319042578
Author:David S. Moore, William I. Notz, Michael A. Fligner
Publisher:W. H. Freeman
Introduction to the Practice of Statistics
Statistics
ISBN:9781319013387
Author:David S. Moore, George P. McCabe, Bruce A. Craig
Publisher:W. H. Freeman
Correlation Vs Regression: Difference Between them with definition & Comparison Chart; Author: Key Differences;https://www.youtube.com/watch?v=Ou2QGSJVd0U;License: Standard YouTube License, CC-BY
Correlation and Regression: Concepts with Illustrative examples; Author: LEARN & APPLY : Lean and Six Sigma;https://www.youtube.com/watch?v=xTpHD5WLuoA;License: Standard YouTube License, CC-BY