
Probability and Statistics for Engineering and the Sciences
9th Edition
ISBN: 9781305251809
Author: Jay L. Devore
Publisher: Cengage Learning
expand_more
expand_more
format_list_bulleted
Videos
Textbook Question
Chapter 7.2, Problem 16E
The alternating current (AC) breakdown voltage of an insulating liquid indicates its dielectric strength. The article “Testing Practices for the AC Breakdown Voltage Testing of Insulation Liquids” (IEEE Electrical insulation Magazine, 1995: 21–26) gave the accompanying sample observations on breakdown voltage (kV) of a particular circuit under certain conditions.
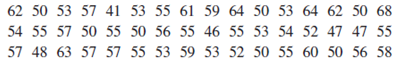
- a. Construct a boxplot of the data and comment on interesting features.
- b. Calculate and interpret a 95% CI for true average breakdown voltage μ. Does it appear that μ has been precisely estimated? Explain.
- c. Suppose the investigator believes that virtually all values of breakdown voltage are between 40 and 70. What
sample size would be appropriate for the 95% CI to have a width of 2 kV (so that μ is estimated to within 1 kV with 95% confidence)?
Expert Solution & Answer

Trending nowThis is a popular solution!

Students have asked these similar questions
Following are measurements of soil concentrations (in mg /kg) of chromium (Cr) and nickel (Ni) at20 sites in the area of Cleveland, Ohio. These data are taken from the article "Variation in NorthAmerican Regulatory Guidance for Heavy Metal Surface Soil Contamination at Commercial andIndustrial Sites" (A. Jennings and J. Ma, J. Environment Eng, 2007:587-609).
Cr: 260 19 36 247 263 319 317 277 319 264 23 29 61 119 33 281 21 35 64 30Ni: 435 377 359 53 38 38 54 188 397 33 92 490 28 35 799 347 321 32 74 508
(a) Construct a histogram for each set of concentrations.
(b) Find the 1st, 2nd and 3rd quartiles for the Cr concentrations
(c) Find the 1st, 2nd and 3rd quartiles for the Ni concentrations.
Following are measurements of soil concentrations (in mg /kg) of chromium (Cr) and nickel (Ni) at20 sites in the area of Cleveland, Ohio. These data are taken from the article "Variation in NorthAmerican Regulatory Guidance for Heavy Metal Surface Soil Contamination at Commercial andIndustrial Sites" (A. Jennings and J. Ma, J. Environment Eng, 2007:587-609).Cr: 260 19 36 247 263 319 317 277 319 264 23 29 61 119 33 281 21 35 64 30Ni: 435 377 359 53 38 38 54 188 397 33 92 490 28 35 799 347 321 32 74 508
(d) Use these to construct comparative boxplots for the two sets of concentrations.
(e) Using the boxplots, what differences can be seen between the two sets of concentrations?
An experiment was conducted in order to determine if cerebral blood flow in human beings can be predicted from arterial oxygen tension (millimeters of mercury). Fifteen patients
Page 472 in the study, and the following data were collected:
Blood Flow, Arterial Oxygen
Y
Tension, a
84.33
603.40
87.80
582.50
82.20
556.20
78.21
594.60
78.44
558.90
80.01
575.20
TT
83.53
580.10
79.46
451.20
75.22
404.00
76.58
484.00
77.90
452.40
78.80
448.40
80.67
334.80
86.60
320.30
350.30
78.20
Estimate the "b" in the quadratic regression equation: y=a+bx+cx². Use 2 decimal places.
Chapter 7 Solutions
Probability and Statistics for Engineering and the Sciences
Ch. 7.1 - Consider a normal population distribution with the...Ch. 7.1 - Each of the following is a confidence interval for...Ch. 7.1 - Suppose that a random sample of 50 bottles of a...Ch. 7.1 - A CI is desired for the true average stray-load...Ch. 7.1 - Assume that the helium porosity (in percentage) of...Ch. 7.1 - On the basis of extensive tests, the yield point...Ch. 7.1 - By how much must the sample size n be increased if...Ch. 7.1 - Let 1 0, 2 0, with 1 + 2 = . Then P(z1X-/nz2)=1-...Ch. 7.1 - a. Under the same conditions as those leading to...Ch. 7.1 - A random sample of n = 15 heat pumps of a certain...
Ch. 7.1 - Consider the next 1000 95% CIs for that a...Ch. 7.2 - The following observations are lifetimes (days)...Ch. 7.2 - The article Gas Cooking. Kitchen Ventilation, and...Ch. 7.2 - The negative effects of ambient air pollution on...Ch. 7.2 - Determine the confidence level for each of the...Ch. 7.2 - The alternating current (AC) breakdown voltage of...Ch. 7.2 - Exercise 1.13 gave a sample of ultimate tensile...Ch. 7.2 - The U.S. Army commissioned a study to assess how...Ch. 7.2 - The article Limited Yield Estimation for Visual...Ch. 7.2 - TV advertising agencies face increasing challenges...Ch. 7.2 - In a sample of 1000 randomly selected consumers...Ch. 7.2 - The technology underlying hip replacements has...Ch. 7.2 - The Pew Forum on Religion and Public Life reported...Ch. 7.2 - A sample of 56 research cotton samples resulted in...Ch. 7.2 - The Pew Forum on Religion and Public Life reported...Ch. 7.2 - The superintendent of a large school district,...Ch. 7.2 - Reconsider the CI (7.10) for p, and focus on a...Ch. 7.3 - Determine the values of the following quantities:...Ch. 7.3 - Determine the t critical value(s) that will...Ch. 7.3 - Determine the t critical value for a two-sided...Ch. 7.3 - Determine the t critical value for a lower or an...Ch. 7.3 - According to the article Fatigue Testing of...Ch. 7.3 - The article Measuring and Understanding the Aging...Ch. 7.3 - A sample of 14 joint specimens of a particular...Ch. 7.3 - Silicone implant augmentation rhinoplasty is used...Ch. 7.3 - A normal probability plot of the n = 26...Ch. 7.3 - A study of the ability of individuals to walk in a...Ch. 7.3 - Ultra high performance concrete (UHPC) is a...Ch. 7.3 - Exercise 72 of Chapter 1 gave the following...Ch. 7.3 - Prob. 40ECh. 7.3 - A more extensive tabulation of t critical values...Ch. 7.4 - Determine the values of the following quantities:...Ch. 7.4 - Determine the following: a. The 95th percentile of...Ch. 7.4 - The amount of lateral expansion (mils) was...Ch. 7.4 - Wire electrical-discharge machining (WEDM) is a...Ch. 7.4 - Wire electrical-discharge machining (WEDM) is a...Ch. 7 - Example 1.11 introduced the accompanying...Ch. 7 - The article Distributions of Compressive Strength...Ch. 7 - For those of you who dont already know, dragon...Ch. 7 - A journal article reports that a sample of size 5...Ch. 7 - Unexplained respiratory symptoms reported by...Ch. 7 - High concentration of the toxic element arsenic is...Ch. 7 - Aphid infestation of fruit trees can be controlled...Ch. 7 - It is important that face masks used by...Ch. 7 - A manufacturer of college textbooks is interested...Ch. 7 - The accompanying data on crack initiation depth...Ch. 7 - In Example 6.8, we introduced the concept of a...Ch. 7 - Prob. 58SECh. 7 - Prob. 59SECh. 7 - Prob. 60SECh. 7 - Prob. 61SECh. 7 - Prob. 62SE
Knowledge Booster


Learn more about
Need a deep-dive on the concept behind this application? Look no further. Learn more about this topic, statistics and related others by exploring similar questions and additional content below.Similar questions
- Samples are collected from the River X and pH values are observed. 9 different pH values arelisted in table 3.Table 3Concentrations 4.2 3.8 6.0 3.5 8.1 4.9 4.1 3.2 4.0Draw box plot and finda. Bowley’s coefficient of skewnessb. Karl Pearson’s coefficient of skewnessc. Third momentRubricStages of Process MarksImagine and Plan 2Composition 2Effort 1arrow_forwardQ.1 An Electronic equipment used for the analysis and storage of the data in an industry has three identical input devices/ports. Different components of the electronic equipment are connected to each other as shown in Figure Q.1. Assume the following estimated reliability values of the components as shown in Table Q.1. Calculate the reliability of the electronic equipment operating successfully with at least one input device/port for 1000 hours? Also, estimate Mean Time to Failure (MTTF) for the electronic equipment for 1000 hrs. Table Q.1 Component Failure rate (2) x 10°, per hr Input device/Port Storage drive Central Processing Unit (CPU) Manual Key Pad Monitor/screen to display results 45 35 7 5 10 Input device 1 Monitor/ Storage device Manual Input device 2 CPU Кeурad screen Input Figure Q.1 device 3arrow_forwardSilicon chip manufacturers require the use of so-called "clean rooms" in which the air is filtered in a special way to keep the number of dust particles to a minimum. Five air samples were taken in each room and the dust level was measured on a scale of 1 (low) to 10 (high). Room 1 Room 2 Room 3 5 3 1 6.5 6 1.5 4 4 3 7 4.5 2.5 6 3 4 a) Do an analysis of variance and interpret the result.b) Based on the above results, if appropriate, use the Tukey-Kramer test to make all pairwise comparisons of clean rooms.arrow_forward
- One operation of a mill is to cut pieces of steel into parts that will later be used as the frame for front seats in an automobile. The steel is cut with a diamond saw and requires the resulting parts to be within 10.005 inch of the length specified by the automobile company. Data are collected from a sample of 50 steel parts and are shown in the following table. The measurement reported is the difference in inches between the actual length of the steel part, as measured by a laser measurement device, and the specified length of the steel part. For example, the first value, -0.003, represents a steel part that is 0.003 inch shorter than the specified length. Complete parts a through c Click the icon to view the data table. a. Construct a frequency distribution Difference in Length -0.005 but less than -0.003: -0.003but less than -0.001 -0.001but less than 0.001 0.001but less than 0.003 0.003but less than 0.005 Frequency Difference Between Actual and Specified Lengths 0.002 0 -0.003…arrow_forwardA sociologist wants to determine if the life expectancy of people in Africa is less than the life expectancy of people in Asia. The data obtained is shown in the table below. Africa Asia = 63.3 yr. 1 X,=65.2 yr. 2 o, = 9.1 yr. = 7.3 yr. n1 = 120 = 150arrow_forward1. Analyze the data as a two way factorial design. Johnson and Leone (Statistics and Experimental Design in Engineering and the Physical Sciences, Wiley, 977) describe an experiment to investigate warping of copper plates. The two factors studied were the temperature and the copper content of the plates. The response variable was a measure of the amount of warping. The data were as follows: Temperature (°C) 50 75 100 125 40 17, 20 12,9 16, 12 21, 17 Copper Content (%) 60 80 16, 21 18, 13 18, 21 23, 2! 24, 22 17, 12 25, 23 23, 22 100 28, 27 27, 31 30, 23 29, 31arrow_forward
- The article "Characteristics and Trends of River Discharge into Hudson, James, and Ungava Bays, 1964-2000" (S. Dery, M. Stieglitz, et al., Journal of Climate, 2005:2540-2557) presents measurements of discharge rate x (in kmlyr) andpeakflow y (in m/s) for 42 rivers that drain into the Hudson, James, and Ungava Bays. The data are shown in the following table: Discharge Peak Flow 94.24 4110.3 66.57 4961.7 59.79 10275.5 48.52 6616.9 40.00 7459.5 32.30 2784.4 31.20 3266.7 30.69 4368.7 26.65 1328.5 22.75 4437.6 21.20 1983.0 20.57 1320.1 19.77 1735.7 18.62 1944.1 17.96 3420.2 17.84 2655.3 16.06 3470.3 1561.6 14.69 11.63 869.8 11.19 936.8 11.08 1315.7 10.92 1727.1 9.94 768.1 7.86 483.3arrow_forwardC-4) The concentration of active ingredient in a liquid laundry detergent is thought to be affected by the type of catalyst used in the process. Ten observations on concentration are taken with each catalyst, and the data follow: Catalyst 1: 57.9, 66.2. 65.4, 65.4, 65.2. 62.6, 67.6, 63.7, 67.2. 71.0 Catalyst 2: 66.4. 71.7. 70.3. 69.3, 64.8, 69.6, 68.6, 69.4, 65.3, 68.8. Find a 95% confidence interval on the ratio of active concentrations for the two catalysts, and explain it.arrow_forwardA random sample of 150 individuals (males and females) was surveyed, and the individuals were asked to indicate their year incomes. The results of the survey are shown below. Income Category Category 1: $20,000 up to $40,000 Category 2: $40,000 up to $60,000 Category 3: $60,000 up to $80,000 Edit Format Table Test at a = .05 to determine if the yearly income is independent of the gender. (CSLO 1,6,7) 12pt Male 10 35 15 V Paragraph BI U A Female 30 15 45 > 2 T² :arrow_forward
- An article in the Journal of Environmental Engineering (1989, Vol. 115(3), pp. 608–619) reported the results of a study on the occurrence of sodium and chloride in surface streams in central Rhode Island. The following data are chloride concentration y (in milligrams per liter) and roadway area in the watershed x (in percentage).arrow_forwardRecall the empirical One study, published in 1972 by R. Risebrough, (Proceedings of the 6th Berkeley Symposium on Mathematics and Statistics, VI, University of California Press, 443–463). In that study, 60 Anacapa pelican eggs were collected and measured for their shell thickness, in millimeters (mm), and concentration of PCBs, in parts per million (ppm). The PCB concentrations are presented in the following table: Draw the relative frequency histogram Is it reasonable to apply the Empirical rule to estimate the percentages of observations that lie within one, two, and three standard deviations to either side of the mean? Use the empirical rule to estimate the percentages of observations that lie within one, two, and three standard deviations to either side of the Use the data to obtain the exact percentages of observations that lie within one, two, and three standard deviations to either side of the Compare your answers in parts (b) and (c).arrow_forwardQ.No.2. What do you mean by Absolute and Relative measure of dispersion? State the uses of a) Coefficient of Variation in Statistical analysis. b) Two candidates X and Y at the B.A (Hons.) examination obtained the following marks in ten papers: Paper 1 2 3 4 7 8. 9 10 X. 58 49 76 80 47 72 61 59 77 48 Y 39 38 86 72 75 69 57 49 83 66 Which of the candidate showed the more consistent performance? Which of the candidate has greater absolute dispersion? 6.arrow_forward
arrow_back_ios
SEE MORE QUESTIONS
arrow_forward_ios
Recommended textbooks for you
 MATLAB: An Introduction with ApplicationsStatisticsISBN:9781119256830Author:Amos GilatPublisher:John Wiley & Sons Inc
 Probability and Statistics for Engineering and th...StatisticsISBN:9781305251809Author:Jay L. DevorePublisher:Cengage Learning
 Statistics for The Behavioral Sciences (MindTap C...StatisticsISBN:9781305504912Author:Frederick J Gravetter, Larry B. WallnauPublisher:Cengage Learning
 Elementary Statistics: Picturing the World (7th E...StatisticsISBN:9780134683416Author:Ron Larson, Betsy FarberPublisher:PEARSON
 The Basic Practice of StatisticsStatisticsISBN:9781319042578Author:David S. Moore, William I. Notz, Michael A. FlignerPublisher:W. H. Freeman
 Introduction to the Practice of StatisticsStatisticsISBN:9781319013387Author:David S. Moore, George P. McCabe, Bruce A. CraigPublisher:W. H. Freeman
MATLAB: An Introduction with Applications
Statistics
ISBN:9781119256830
Author:Amos Gilat
Publisher:John Wiley & Sons Inc
Probability and Statistics for Engineering and th...
Statistics
ISBN:9781305251809
Author:Jay L. Devore
Publisher:Cengage Learning
Statistics for The Behavioral Sciences (MindTap C...
Statistics
ISBN:9781305504912
Author:Frederick J Gravetter, Larry B. Wallnau
Publisher:Cengage Learning
Elementary Statistics: Picturing the World (7th E...
Statistics
ISBN:9780134683416
Author:Ron Larson, Betsy Farber
Publisher:PEARSON
The Basic Practice of Statistics
Statistics
ISBN:9781319042578
Author:David S. Moore, William I. Notz, Michael A. Fligner
Publisher:W. H. Freeman
Introduction to the Practice of Statistics
Statistics
ISBN:9781319013387
Author:David S. Moore, George P. McCabe, Bruce A. Craig
Publisher:W. H. Freeman
Hypothesis Testing using Confidence Interval Approach; Author: BUM2413 Applied Statistics UMP;https://www.youtube.com/watch?v=Hq1l3e9pLyY;License: Standard YouTube License, CC-BY
Hypothesis Testing - Difference of Two Means - Student's -Distribution & Normal Distribution; Author: The Organic Chemistry Tutor;https://www.youtube.com/watch?v=UcZwyzwWU7o;License: Standard Youtube License