
Probability and Statistics for Engineering and the Sciences
9th Edition
ISBN: 9781305251809
Author: Jay L. Devore
Publisher: Cengage Learning
expand_more
expand_more
format_list_bulleted
Videos
Textbook Question
thumb_up100%
Chapter 7.2, Problem 17E
Exercise 1.13 gave a sample of ultimate tensile strength observations (ksi). Use the accompanying
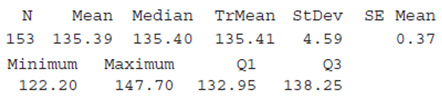
| N | Mean | TrMean | StDev | SE Mean | |
| 153 | 135.39 | 135.40 | 135.41 | 4.59 | 0.37 |
| Minimum | Maximum | Q1 | Q3 |
| 122.20 | 147.70 | 132.95 | 138.25 |
Expert Solution & Answer

Trending nowThis is a popular solution!

Students have asked these similar questions
The white wood material used for the roof of an ancient temple is imported from a certain country. The wooden roof must withstand as much as 100 centimeters of snow in the winter. Architects at a university conducted a study to
estimate the mean bending strength of the white wood roof. A sample of 25 pieces of the imported wood were tested and yielded the statistics x= 72.7 and s = 11.4 on breaking strength (MPa). Estimate the true mean breaking
strength of the white wood with a 99% confidence interval. Interpret the result.
Find the 99% confidence interval for the true mean breaking strength of the white wood.
(Round to two decimal places as needed.)
The health of the bear population in Yellowstone National park is monitored by periodic measurements taken from anesthetized bears. A sample 54 bears has a mean weight of 182.9 lb. And mean is known as 121.8 lb. find a 99% confidence estimate of the population of all bear weights
People with high blood pressure suffer from hypertension. Data on fasting blood sugar (milligrams/deciliter) and magnesium (milligrams/deciliter) in blood specimens collected from 50 patients diagnosed with hypertension were collected. The accompanying technology printout gives 95% confidence intervals for the mean
fasting blood sugar (FBS) and mean magnesium level (MAG). Use this information to complete parts a through d below.
Variable
Mean
StDev
SE Mean
958 CI
FBS
50
104.99
37.05
5.24
94.47,
115.51 )
MAG
50
1.83173
0.05298
0.00749
( 1.8166B,
1.84678)
a. Locate and interpret the 95% confidence interval for mean fasting blood sugar on the printout.
(Type integers or decimals. Do not round.)
O A. The 95% confidence interval for mean fasting blood sugar indicates that the mean fasting blood sugar level will be between
and
milligrams per deciliter in 95% of similarly constructed samples.
B. The 95% confidence interval for mean fasting blood sugar indicates that the true mean fasting…
Chapter 7 Solutions
Probability and Statistics for Engineering and the Sciences
Ch. 7.1 - Consider a normal population distribution with the...Ch. 7.1 - Each of the following is a confidence interval for...Ch. 7.1 - Suppose that a random sample of 50 bottles of a...Ch. 7.1 - A CI is desired for the true average stray-load...Ch. 7.1 - Assume that the helium porosity (in percentage) of...Ch. 7.1 - On the basis of extensive tests, the yield point...Ch. 7.1 - By how much must the sample size n be increased if...Ch. 7.1 - Let 1 0, 2 0, with 1 + 2 = . Then P(z1X-/nz2)=1-...Ch. 7.1 - a. Under the same conditions as those leading to...Ch. 7.1 - A random sample of n = 15 heat pumps of a certain...
Ch. 7.1 - Consider the next 1000 95% CIs for that a...Ch. 7.2 - The following observations are lifetimes (days)...Ch. 7.2 - The article Gas Cooking. Kitchen Ventilation, and...Ch. 7.2 - The negative effects of ambient air pollution on...Ch. 7.2 - Determine the confidence level for each of the...Ch. 7.2 - The alternating current (AC) breakdown voltage of...Ch. 7.2 - Exercise 1.13 gave a sample of ultimate tensile...Ch. 7.2 - The U.S. Army commissioned a study to assess how...Ch. 7.2 - The article Limited Yield Estimation for Visual...Ch. 7.2 - TV advertising agencies face increasing challenges...Ch. 7.2 - In a sample of 1000 randomly selected consumers...Ch. 7.2 - The technology underlying hip replacements has...Ch. 7.2 - The Pew Forum on Religion and Public Life reported...Ch. 7.2 - A sample of 56 research cotton samples resulted in...Ch. 7.2 - The Pew Forum on Religion and Public Life reported...Ch. 7.2 - The superintendent of a large school district,...Ch. 7.2 - Reconsider the CI (7.10) for p, and focus on a...Ch. 7.3 - Determine the values of the following quantities:...Ch. 7.3 - Determine the t critical value(s) that will...Ch. 7.3 - Determine the t critical value for a two-sided...Ch. 7.3 - Determine the t critical value for a lower or an...Ch. 7.3 - According to the article Fatigue Testing of...Ch. 7.3 - The article Measuring and Understanding the Aging...Ch. 7.3 - A sample of 14 joint specimens of a particular...Ch. 7.3 - Silicone implant augmentation rhinoplasty is used...Ch. 7.3 - A normal probability plot of the n = 26...Ch. 7.3 - A study of the ability of individuals to walk in a...Ch. 7.3 - Ultra high performance concrete (UHPC) is a...Ch. 7.3 - Exercise 72 of Chapter 1 gave the following...Ch. 7.3 - Prob. 40ECh. 7.3 - A more extensive tabulation of t critical values...Ch. 7.4 - Determine the values of the following quantities:...Ch. 7.4 - Determine the following: a. The 95th percentile of...Ch. 7.4 - The amount of lateral expansion (mils) was...Ch. 7.4 - Wire electrical-discharge machining (WEDM) is a...Ch. 7.4 - Wire electrical-discharge machining (WEDM) is a...Ch. 7 - Example 1.11 introduced the accompanying...Ch. 7 - The article Distributions of Compressive Strength...Ch. 7 - For those of you who dont already know, dragon...Ch. 7 - A journal article reports that a sample of size 5...Ch. 7 - Unexplained respiratory symptoms reported by...Ch. 7 - High concentration of the toxic element arsenic is...Ch. 7 - Aphid infestation of fruit trees can be controlled...Ch. 7 - It is important that face masks used by...Ch. 7 - A manufacturer of college textbooks is interested...Ch. 7 - The accompanying data on crack initiation depth...Ch. 7 - In Example 6.8, we introduced the concept of a...Ch. 7 - Prob. 58SECh. 7 - Prob. 59SECh. 7 - Prob. 60SECh. 7 - Prob. 61SECh. 7 - Prob. 62SE
Knowledge Booster


Learn more about
Need a deep-dive on the concept behind this application? Look no further. Learn more about this topic, statistics and related others by exploring similar questions and additional content below.Similar questions
- The manager of the purchasing department of a large saving and loan organization would like to develop a model to predict the amount of time (measured in hours) it takes to record a loan application. Data are collected from a sample of 30 days, and the number of applications recorded and completion time in hours is recorded. Attached below is the regression output. What can be said about the 90% confidence interval for the mean change in the amount of time needed as a result of recording one additional loan application? Question content area bottom Part 1 A. The 90% confidence interval is narrower than [0.0109, 0.0143]. B. The 90% confidence interval is wider than [0.1492, 0.6555]. C. The 90% confidence interval is wider than [0.0109, 0.0143].arrow_forwardThe table below lists weights (carats) and prices (dollars) of randomly selected diamonds. Find the (a) explained variation, (b) unexplained variation, and (c) indicated prediction interval. There is sufficient evidence o support a claim of a linear correlation, so it is reasonable to use the regression equation when making predictions. For the prediction interval, use a 95% confidence level with a diamond that weighs 0.8 carats. Weight Price 0.3 $508 a. Find the explained variation. 0.4 $1153 0.5 $1332 Round to the nearest whole number as needed.) . Find the unexplained variation. Round to the nearest whole number as needed.) c. Find the indicated prediction interval.arrow_forwardA study was carried out to compare the mean compressive strength of two types of concrete. 10 samples of each type of concrete were collected. Data (in psi) are presented in the next table. (The data table is in the picture) Assuming normality, determine a 95% confidence interval for the difference of the stockings and interpret it. Note: Solve what is requested step by step in order to arrive at the answer, do not skip steps.arrow_forwardDuring October of 2019, Alex sampled 400 people and determined their employment status and age. Alex found the information in the following table. Under 25 Years Old 25-55 Years Old Over 55 Years Old https://www.bls.gov/web/empsit/cpseea10.htm 0.032 Perform a chi-squared test of independence to test the null hypothesis that age and employment status are independent versus the alternative that they are dependent. What is the p- value for this test? 0.016 8.25 Is Employed 129 140 142 0.979 Isn't Employed 21 10 8 B B Barrow_forwardAssume researchers are trying to find out the mean concentration levels of a specific drug in a population of individuals' blood during a clinical trial. The researchers find that the sample population of 30 has a mean concentration of 6.7 mcg/ml with a standard deviation of 1.3 mcg/ml. Calculate a 95% confidence interval for the mean concentration level of the medication for the mean concentration level of the medication for the populations blood and interpret it.arrow_forwardThe result of tension adhesion test of 20 alloy samples are given below. Find the 95% two-sided confidence intervals on the mean tension adhesion. 19.8 11.9 17.6 18.5 15.4 15.4 13.6 14.1 11.4 11.9 7.5 8.8 19.5 15.8 12.7 14.9 10.1 11.4 16.7 7.9arrow_forwardProvide and interpret a 95% confidence interval for the variable HEIGHT What would the R-code for this be?arrow_forwardEach year 7% of the world tiger population is killed by poachers. Now that there is a campaign to educate people on the problem, has this percent increased? 200 tigers were observed and 22 were killed by poachers. For your hypothesis test, assume the distribution of tigers in the wild is normally distributed and use a significance level of 0.05. What is the Z crit?arrow_forwardResearchers recruited a sample of 40 female and 40 male heterosexual Caucasian undergraduate students from British universities for a study of the attractiveness of body types. Among adults, a body mass index (BMI, in kg/m2 ) value between 18.5 and 24.9is considered healthy, but attractiveness may not be entirely about health. Using a 3D computer avatar, participants built what they considered the ideal body of an adult of their own gender. The Minitab output for the mean ideal BMI of the women and of the men respectively is shown. From Barbie dolls to runway models, women in Western countries are exposed to unrealistically thin and arguably unhealthy body standards for their gender. Does the study provide evidence that young Caucasian women in British universities, on average, aim for an unhealthy ideal body type (corresponding to a BMI less than 18.5 )? test statistic,t = p-value =arrow_forwardA study was conducted to 60 students to identify their eating style and stress level during the period of movement control order (MCO) 3.0 in 2021. Researchers also identified the type of food preferred, gender and race of each respondent involved. Table 1 Descriptives Eating style Race N Mean Std. Deviation Std. Error 95% Confidence Interval for Mean Minimum Maximum Lower Bound Upper Bound Malay 36 17.31 2.424 .404 13.49 15.13 9 20 Chinese 13 11.23 2.048 .568 11.99 14.47 10 16 Indian 11 15.09 3.270 .986 11.89 16.29 8 20 Total 60 14.54 2.518 .325 13.38 14.68 8 20 Table 2 ANOVA Eating Style Sum of Squares df Mean Square F Sig. Between Groups 11.078 2 5.539 .770 .506 Within Groups 362.856 57 6.366 Total 373.933 59 Table 3 Multiple Comparisons Dependent Variable:…arrow_forwardIndustrial light bulbs should have a mean life length acceptable to potential users and a relatively small variation in life length. If some bulbs fail too early in their life, users become annoyed and are likely to switch to bulbs produced by a different manufacturer. Large variations above the mean reduce replacement sales; in general, variation in life lengths disrupts the user’s replacement schedules. A random sample of 20 bulbs produced by a particular manufacturer produced the following lengths of life (in hours):2100, 2302, 1951, 2067, 2415, 1883, 2101, 2146, 2278, 2019, 1924, 2183, 2077, 2392, 2286, 2501, 1946, 2161, 2253, 1827.(a) Find a 99% confidence interval for the standard deviation of the lengths of life for the bulbs produced by this manufacturer. (b) Is the true population standard deviation possibly less than 150 hours? Why or why not?arrow_forwardA neurological disease is characterized by gait imbalance. To provide effective treatment, it is important to detect the disease as soon as possible. In an experiment, age at onset of symptoms and age at diagnosis for 18 patients suffering from the disease were recorded for the same patients (in months). The differences in age were observed to be -38.60 months with a sample standard distribution of 23.18. Calculate a lower 95% confidence bound for the population mean difference and interpret the answer. show all workarrow_forwardarrow_back_iosSEE MORE QUESTIONSarrow_forward_ios
Recommended textbooks for you
 Glencoe Algebra 1, Student Edition, 9780079039897...AlgebraISBN:9780079039897Author:CarterPublisher:McGraw Hill
Glencoe Algebra 1, Student Edition, 9780079039897...
Algebra
ISBN:9780079039897
Author:Carter
Publisher:McGraw Hill
Hypothesis Testing using Confidence Interval Approach; Author: BUM2413 Applied Statistics UMP;https://www.youtube.com/watch?v=Hq1l3e9pLyY;License: Standard YouTube License, CC-BY
Hypothesis Testing - Difference of Two Means - Student's -Distribution & Normal Distribution; Author: The Organic Chemistry Tutor;https://www.youtube.com/watch?v=UcZwyzwWU7o;License: Standard Youtube License