
Concept explainers
Videos
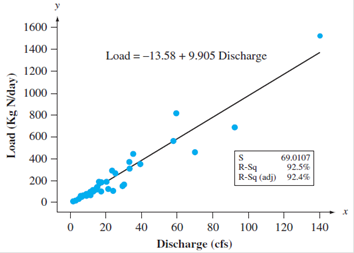
The accompanying scatterplot is based on data provided by authors of the article “Spurious
| Full sample | (140,152935) deleted | |
| 9.9050 | 8.8241 | |
| .3806 | .4734 |
Does this observation appear to have had a substantial impact on the estimated slope? Explain.

Trending nowThis is a popular solution!

Chapter 13 Solutions
Probability and Statistics for Engineering and the Sciences


- Gestation For women, pregnancy lasts about 9 months.In other species of animals, the length of time fromconception to birth varies. Is there any evidence thatthe gestation period is related to the animal’s lifespan?The first scatterplot shows Gestation Period (indays) vs. Life Expectancy (in years) for 18 speciesof mammals. The highlighted point at the far rightrepresents humans. a) For these data, r = 0.54, not a very strong relation-ship. Do you think the association would be stronger or weaker if humans were removed?Explain.b) Is there reasonable justification for removing humansfrom the data set? Explain.c) Here are the scatterplot and regression analysis for the17 nonhuman species. Comment on the strength of theassociation.d) Interpret the slope of the line.e) Some species of monkeys have a life expectancy ofabout 20 years. Estimate the expected gestation periodof one of these monkeys.arrow_forwardAa Febru The body mass index (BMI) of a person is defined to be the person's body mass divided by the square of the person's height. The article "Influences of Parameter Uncertainties within the ICRP 66 Respiratory Tract Model: Particle Deposition" (W. Bolch, E. Farfan, et al., Health Physics, 2001:378-394) states that body mass index (in kg/m2) in men aged 25-34 is lognormally distributed with parameters u = 3.215 and o = 0.157. a.Find the mean and standard deviation BMI for men aged 25-34. b.Find the standard deviation of BMI for men aged 25-34. c.Find the median BMI for men aged 25-34. d.What proportion of men aged 25-34 have a BMI less than 20? e.Find the 80th percentile of BMI for men agėd 25 -34. 04... Rext 田arrow_forwardPlease use the accompanying Excel data set or accompanying Text file data set when completing the following exercise. An article in Wood Science and Technology, "Creep in Chipboard, Part 3: Initial Assessment of the Influence of Moisture Content and Level of Stressing on Rate of Creep and Time to Failure" (1981, Vol. 15, pp. 125-144) studied the deflection (mm) of particleboard from stress levels of relative humidity. Assume that the two variables are related according to the simple linear regression model. The data are shown below x = Stress level (%) 54 54 61 61 68 68 75 75 75 y = Deflection (mm) 16.473 18.693 14.305 15.121 13.505 11.64 11.168 12.534 11.224 a. Calculate the least square estimates of the intercept (a) and slope (b). What is the estimate of o (c)? b. Find the estimate of the mean deflection if the stress level can be limited to 61% (d). c. Estimate the change in the mean deflection associated with a 7% increment in stress level (e). (a) i (Round your answer to 2…arrow_forward
- Please use the accompanying Excel data set or accompanying Text file data set when completing the following exercise. An article in Wood Science and Technology, "Creep in Chipboard, Part 3: Initial Assessment of the Influence of Moisture Content and Level of Stressing on Rate of Creep and Time to Failure" (1981, Vol. 15, pp. 125-144) studied the deflection (mm) of particleboard from stress levels of relative humidity. Assume that the two variables are related according to the simple linear regression model. The data are shown below x = Stress level (%) 54 54 61 61 68 68 75 75 75 y = Deflection (mm) 16.473 18.693 14.305 15.121 13.505 11.64 11.168 12.534 11.224 a. Calculate the least square estimates of the intercept (a) and slope (b). What is the estimate of o² (c)? b. Find the estimate of the mean deflection if the stress level can be limited to 66% (d). c. Estimate the change in the mean deflection associated with a 8% increment in stress level (e). (a) i (Round your answer to 2…arrow_forwardThe mean arterial pressure (or MAP, average arterial pressure in one cardiac cycle) is a measure for perfusion status. You are interested to know if it is possible to predict an adult's MAP (Y) based on the body surface area (X). Suppose you randomly selected 50 adults, and measured their mean arterial blood pressure (in mmHg) & body surface area (in m2). The results are reflected below: I = 1.6 s, = 0.5 y = 80.1 s, = 16.9 r 0.8 %3D %3D (Source: Nall, R. (2018, April 10). Mean arterial pressure: Normal, low, high readings plus treatment. Retrieved from https://www.healthline.com/health/mean-arterlal-pressurel There is a 99.7% chance that the actual MAP of those with body surface area of 1.66 m2 falls between and OA) 61.5; 102.0 B) 58.9; 104.5 O C) 66.5; 96.9 O D) 71.6; 91.9 E) 51.3; 112.1arrow_forward1. Analyze the data as a two way factorial design. Johnson and Leone (Statistics and Experimental Design in Engineering and the Physical Sciences, Wiley, 977) describe an experiment to investigate warping of copper plates. The two factors studied were the temperature and the copper content of the plates. The response variable was a measure of the amount of warping. The data were as follows: Temperature (°C) 50 75 100 125 40 17, 20 12,9 16, 12 21, 17 Copper Content (%) 60 80 16, 21 18, 13 18, 21 23, 2! 24, 22 17, 12 25, 23 23, 22 100 28, 27 27, 31 30, 23 29, 31arrow_forward
- Pls. help me in my Stat about CORRELATION ANALYSIS, SIMPLE REGRESSION ANALYSIS & PATH ANALYSIS IN Rarrow_forwardDescribe and compare the measurement of the central tendency and thedispersion of the electric usage before and after implementing the newelectric meter based on the histogram and box plots given.arrow_forwardNW 6.12 CORPORATE SUSTAINABILITY OF CPA FIRMS. Corporate sustainability refers to business practices designed CORSUS around social and environmental considerations. Refer to the Business and Society (March 2011) study on the sustainability behaviors of CPA corporations, Exercise 2.23 (p. 59). Recall that the level of support for corporate sustainability (measured on a quantitative scale ranging from 0 to 160 points) was obtained for each in a sample of 992 senior managers at CPA firms. Higher point values indicate a higher level of support for sustainability. The accompanying StatCrunch printout gives a 99% confidence interval for the mean level of support for all senior managers at CPA firms. One sample T confidence interval: μ: Mean of variable 99% confidence interval results: Variable Sample Mean Std. Err. DF L. Limit U. Limit Support 67.75504 0.85314633 991 65.553241 69.95684 a. Locate the 99% confidence interval on the printout. b. Use the sample mean and standard deviation on the…arrow_forward
- OphthalmologyRetinitis pigmentosa (RP) is a hereditary ocular diseasein which patches of pigment appear on the retina, potentially resulting in substantial vision loss and in somecases complete blindness. An important issue is how fastthe subjects decline. Visual field is an important measureof area of vision, which is measured in degree2. A visualfield area for a normal person is around 11,000 degree2.The longitudinal data in Table 11.29 were provided by anindividual patient.Table 11.29 Longitudinal visual field data forone RP patientTime Visual field area lnVisit (yr) (degree2) (visual field area)1 0 3059 8.032 1 3053 8.023 2 1418 7.264 3 1692 7.435 4 1978 7.596 5 1567 7.367 6 1919 7.568 7 1998 7.609 11 1648 7.4110 13 1721 7.4511 15 1264 7.14mean 6.09 1938 7.532sd 4.97 597 0.280Suppose the rate of change of ln (visual field) is a linearfunction of follow-up time.11.103 Write down a linear regression model that summarizes this relationship.11.104 Fit the regression line using…arrow_forwarduse the previous data its the contueniousationarrow_forward"Durable press" cotton fabrics are treated to improve their recovery from wrinkles after washing. "Wrinkle recovery angle" measures how well a fabric recovers from wrinkles. Higher is better. Here are data on the wrinkle recovery angle (in degrees) for two types of treated fabrics: Permafresh Hylite 15 17 12 14 13 16 16 15 14 18 A manufacturer wants to know how large is the difference in mean wrinkle recovery angle. Give a 98% con fidence interval for the difference in mean wrinkle recovery angle: [three decimal accuracy] [three decimal accuracy]arrow_forward
 Glencoe Algebra 1, Student Edition, 9780079039897...AlgebraISBN:9780079039897Author:CarterPublisher:McGraw Hill