
Probability and Statistics for Engineering and the Sciences
9th Edition
ISBN: 9781305251809
Author: Jay L. Devore
Publisher: Cengage Learning
expand_more
expand_more
format_list_bulleted
Concept explainers
Videos
Textbook Question
Chapter 13, Problem 71SE
An ammonia bath is the one most widely used for depositing Pd-Ni alloy coatings. The article “Modelling of Palladium and Nickel in an Ammonia Bath in a Rotary Device” (Plating and Surface Finishing. 1997: 102-104) reported on an investigation into how bath-composition characteristics affect coating properties. Consider the following data on .x1 = Pd concentration
(g/dm3), x2 = Ni concentration (g/dm3)d, x3 = pH, x4 = temperature (oc), x5 = cathode current density (A/dm2), and y = palladium content (%) of the coating.
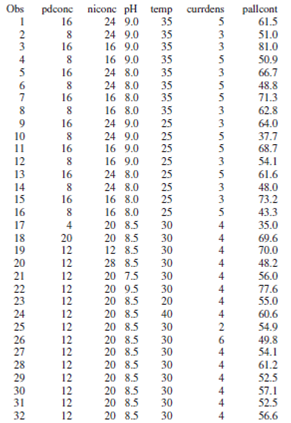
- a. Fit the first-order model with five predictors and assess its utility. Do all the predictors appear to be important?
- b. Fit the complete second-order model and assess its utility.
- c. Does the group of second-order predictors (interaction and quadratic) appear to provide more useful information about y than is contributed by the first-order predictors? Carry out an appropriate test of hypotheses.
- d. The authors of the cited article recommended the use of all five first-order predictors plus the additional predictor x6 = (pH)2. Fit this model. Do all six predictors appear to be important?
Expert Solution & Answer
Want to see the full answer?
Check out a sample textbook solution
Students have asked these similar questions
The article "Mathematical Modeling of the Argon-Oxygen Decarburization Refining
Process of Stainless Steel: Part II. Application of the Model to Industrial Practice" (J. Wei
and D. Zhu, Metallurgical and Materials Transactions B, 2001:212-217) presents the
carbon content (in mass %) and bath temperature (in K) for 32 heats of austenitic stainless
steel. These data are shown in the following table.
Carbon %
Temp.
1975
19
23
1947
22
1954
16
1992
17
1965
18
1971
12
2046
24
1945
17
1984
20
1991
17.7 Butterfly wings. Researchers studied the morphological attributes of monarch
butterflies (Danaus plexippus), a species that undertakes large seasonal migrations
over North America. They measured the forewing weight (in milligrams, mg) of
a sample of 92 monarch butterflies, all of which had been reared in captivity in
identical conditions.° Figure 17.4 shows the output from the statistical software
JMP. (The data are also available in the Large.Butterfly the data file if you wish
to practice working with your own software.) Estimate with 95% confidence the
mean forewing weight of monarch butterflies reared in captivity. Follow the four-
step process as illustrated in Example 17.2.
4
STEP
そMP
FWweight
30
25
20
15
10
11 12
13
14 15
8
9
10
Summary Statistics
Mean
11.795652
Std Dev
1.1759413
Std Err Mean
0.1226004
Upper 95% Mean
Lower 95% Mean
1 FIGURE 17.4
Software output (JMP) for the
forewing weight of monarch
12.039183
11.552122
92
N.
butterflies.
Count
Need help with (c) and (d)
Mist (airborne droplets or aerosols) is generated when metal-removing fluids are used in machining operations to cool and lubricate the tool and workpiece. Mist generation is a concern to OSHA, which has recently lowered substantially the workplace standard. An article gave the accompanying data on x = fluid-flow velocity for a 5% soluble oil (cm/sec) and y = the extent of mist droplets having diameters smaller than 10 µm (mg/m3):
x
88
177
182
354
369
442
970
y
0.39
0.60
0.50
0.66
0.61
0.69
0.92
(a) The investigators performed a simple linear regression analysis to relate the two variables. Does a scatter plot of the data support this strategy?
(b) What proportion of observed variation in mist can be attributed to the simple linear regression relationship between velocity and mist? (Round your answer to three decimal places.) (c) The investigators were particularly interested in the impact on mist of increasing velocity from 100 to 1000 (a…
Chapter 13 Solutions
Probability and Statistics for Engineering and the Sciences
Ch. 13.1 - Suppose the variables x = commuting distance and y...Ch. 13.1 - Prob. 2ECh. 13.1 - Prob. 3ECh. 13.1 - Prob. 4ECh. 13.1 - As the air temperature drops, river water becomes...Ch. 13.1 - The accompanying scatterplot is based on data...Ch. 13.1 - Prob. 7ECh. 13.1 - Prob. 8ECh. 13.1 - Consider the following four (x, y) data sets; the...Ch. 13.1 - a. Show that i=1nei=0 when the eis are the...
Ch. 13.1 - Prob. 11ECh. 13.1 - Prob. 12ECh. 13.1 - Prob. 13ECh. 13.1 - If there is at least one x value at which more...Ch. 13.2 - No tortilla chip aficionado likes soggy chips, so...Ch. 13.2 - Polyester fiber ropes are increasingly being used...Ch. 13.2 - The following data on mass rate of burning x and...Ch. 13.2 - Failures in aircraft gas turbine engines due to...Ch. 13.2 - Prob. 19ECh. 13.2 - Prob. 20ECh. 13.2 - Mineral mining is one of the most important...Ch. 13.2 - Prob. 22ECh. 13.2 - Prob. 23ECh. 13.2 - Kyphosis refers to severe forward flexion of the...Ch. 13.2 - Prob. 25ECh. 13.3 - The following data on y 5 glucose concentration...Ch. 13.3 - The viscosity (y) of an oil was measured by a cone...Ch. 13.3 - Prob. 29ECh. 13.3 - The accompanying data was extracted from the...Ch. 13.3 - The accompanying data on y 5 energy output (W) and...Ch. 13.3 - Prob. 32ECh. 13.3 - Prob. 33ECh. 13.3 - The following data resulted from an experiment to...Ch. 13.3 - The article The Respiration in Air and in Water of...Ch. 13.4 - Cardiorespiratory fitness is widely recognized as...Ch. 13.4 - A trucking company considered a multiple...Ch. 13.4 - Let y = wear life of a bearing, x1 = oil...Ch. 13.4 - Let y = sales at a fast-food outlet (1000s of ),...Ch. 13.4 - The article cited in Exercise 49 of Chapter 7 gave...Ch. 13.4 - The article A Study of Factors Affecting the Human...Ch. 13.4 - An investigation of a die-casting process resulted...Ch. 13.4 - Prob. 43ECh. 13.4 - The accompanying Minitab regression output is...Ch. 13.4 - The article Analysis of the Modeling Methodologies...Ch. 13.4 - A regression analysis carried out to relate y =...Ch. 13.4 - Efficient design of certain types of municipal...Ch. 13.4 - An experiment to investigate the effects of a new...Ch. 13.4 - Prob. 49ECh. 13.4 - Prob. 50ECh. 13.4 - The article Optimization of Surface Roughness in...Ch. 13.4 - Utilization of sucrose as a carbon source for the...Ch. 13.4 - Prob. 53ECh. 13.4 - Prob. 54ECh. 13.5 - The article The Influence of Honing Process...Ch. 13.5 - Prob. 56ECh. 13.5 - In the accompanying table, we give the smallest...Ch. 13.5 - Prob. 58ECh. 13.5 - Prob. 59ECh. 13.5 - Pillar stability is a most important factor to...Ch. 13.5 - Prob. 61ECh. 13.5 - Prob. 62ECh. 13.5 - Prob. 63ECh. 13.5 - Prob. 64ECh. 13 - Curing concrete is known to be vulnerable to shock...Ch. 13 - Prob. 66SECh. 13 - The article Validation of the Rockport Fitness...Ch. 13 - Feature recognition from surface models of...Ch. 13 - Air pressure (psi) and temperature (F) were...Ch. 13 - An aeronautical engineering student carried out an...Ch. 13 - An ammonia bath is the one most widely used for...Ch. 13 - The article An Experimental Study of Resistance...Ch. 13 - The accompanying data on x = frequency (MHz) and y...Ch. 13 - Prob. 74SECh. 13 - Prob. 75SECh. 13 - The article Chemithermomechanical Pulp from Mixed...Ch. 13 - Prob. 77SECh. 13 - Prob. 78SECh. 13 - Prob. 79SECh. 13 - Prob. 80SECh. 13 - Prob. 81SECh. 13 - Prob. 82SECh. 13 - Prob. 83SE
Knowledge Booster


Learn more about
Need a deep-dive on the concept behind this application? Look no further. Learn more about this topic, statistics and related others by exploring similar questions and additional content below.Similar questions
- An article in the Journal of Applied Polymer Science (Vol. 56, pp. 471–476, 1995) studied the effect of the mole ratio of sebacic acid on the intrinsic viscosity of copolyesters.- The data follows: Viscosity 0.45 0.2 0.34 0.58 0.7 0.57 0.55 0.44 Mole ratio 1 0.9 0.8 0.7 0.6 0.5 0.4 0.3 (a) Construct a scatter diagram of the data.arrow_forwardThe article "Lead Dissolution from Lead Smelter Slags Using Magnesium Chloride Solutions" (A. Xenidis, T. Lillis, and I. Hallikia, The AusIMM Proceedings, 1999:37-14) discusses an investigation of leaching rates of lead in solutions of magnesium chloride. The data in the following table (read from a graph) present the percentage of lead that has been extracted at various times (in minutes). Time (t) 4 8 16 30 60 120 Percent extracted (v) |1.2 1.6 2.3 2.8 3.6 4.4 a. The article suggests fitting a quadratic model y = Bo + B,t + Bz² + ɛ to these data. Fit this model, and compute the standard deviations of the coefficients. b. The reaction rate at time t is given by the derivative dy/dt = B, + 2B,t. Estimate the time at which the reaction rate will be equal to 0.05. c. The reaction rate at t = Oisequal to B1. Find a 95% confidence interval for the reaction rate at t = 0. d. Can you conclude that the reaction rate is decreasing with time? Explain.arrow_forwardAn article in the Journal of the American Ceramic Society, "Rapid Hot-Pressing of Ultrafine PSZ Powders" (1991, Vol. 74, pp. 1547-1553) considered the microstructure of the ultrafine powder of partially stabilized zirconia as a function of temperature. The data are shown below: ... x= Temperature (°C) 1100 1200 1300 1100 | 1500 1200 1300 y - Porosity (%) 30.8 19.2 6 13.5 11.4 7.7 3.6 Find the least squares estimate of the slope. Input answers up to 5 decimal places. Slope = Blank 1arrow_forward
- An article in the Journal of the American Ceramic Society, "Rapid Hot-Pressing of Ultrafine PSZ Powders" (1991, Vol. 74, pp. 1547-1553) considered the microstructure of the ultrafine powder of partially stabilized zirconia as a function of temperature. The data are shown below: ... Temperature (°C) 1100 1200 1300 1100 1500 1200 1300 y - Porosity (%) 30.8 19.2 6 13.5 11.4 7.7 3.6 Find an estimate of o2 Input answers up to two decimal places. o2= Blank 1arrow_forwardAn article in the Journal of the American Ceramic Society, "Rapid Hot-Pressing of Ultrafine PSZ Powders" (1991, Vol. 74, pp. 1547-1553) considered the microstructure of the ultrafine powder of partially stabilized zirconia as a function of temperature. The data are shown below: ... x = Temperature (°C) | 1100 1200 1300 1100 1500 1200 1300 y = Porosity (%) 30.8 19.2 6 13.5 11.4 7.7 3.6 Find the least squares estimate of the slope. Input answers up to 5 decimal places. Slope = Blank 1 Blank 1 Add your answerarrow_forwardThe article "Simulation of the Hot Carbonate Process for Removal of CO, and H,S from Medium Btu Gas" (K. Park and T. Edgar, Energy Progress, 1984:174–180) presents an equation used to estimate the equilibrium vapor pressure of CO, in a potassium carbonate solution. The actual equilibrium pressure (in kPa) was measured in nine different reactions and compared with the value estimated from the equation. The results are presented in the following table: Reaction Estimated Experimental Difference 45.10 42.95 2.15 2 85.77 79.98 5.79 3 151.84 146.17 5.67 4. 244.30 228.22 16.08 5 257.67 240.63 17.04 6 44.32 41.99 2.33 84.41 82.05 2.36 8 150.47 149.62 0.85 253.81 245.45 8.36 Find a 95% confidence interval for the mean difference between the estimated and actual pressures.arrow_forward
- The article “Wastewater Treatment Sludge as a Raw Material for the Production of Bacillus thuringiensis Based Biopesticides” (M. Tirado Montiel, R. Tyagi, and J. Valero, Water Research, 2001:3807–3816) presents measurements of total solids, in g/L, for seven sludge specimens. The results (rounded to the nearest gram) are 20, 5, 25, 43, 24, 21, and 32. Assume the distribution of total solids is approximately symmetric. a) Can you conclude that the mean concentration of total solids is greater than 14 g/L? Compute the appropriate test statistic and find the P-value. b) Can you conclude that the mean concentration of total solids is less than 30 g/L? Compute the appropriate test statistic and find the P-value. c) An environmental engineer claims that the mean concentration of total solids is equal to 18 g/L. Can you conclude that the claim is false?arrow_forwardQ3) An experiment was carried out to investigate variation of solubility of chemical X in water. The quantities in kg that dissolved in 1 liter at various temperatures are show in the table (1). Table (1) Temperature C Mass of X 2.1 2.6 2.9 3.3 15 20 25 30 35 4 50 5.1 70 7 Use the proper methods to answer the following questions: a) Draw a scatter diagram to show the data. b) Estimate the temperature based on the mass of X. c) What quantity might be expected to dissolve at 42 C? Find the quantity that your cquation indicates would dissolve at 10 C and comment on your answer.arrow_forwardComputer chips often contain surface imperfections.For a certain type of computer chip, theprobability mass function of the number of defects X is presented in the following table.arrow_forward
- An article in the Journal of the American Ceramic Society, "Rapid Hot-Pressing of Ultrafine PSZ Powders" (1991, Vol. 74, pp. 1547-1553) considered the microstructure of the ultrafine powder of partially stabilized zirconia as a function of temperature. The data are shown below: x = Temperature (°C)|1100 1200 1300 1100 1500 1200 1300 y = Porosity (%) 30.8 19.2 6 13.5 11.4 7.7 3.6 Find an estimate of o?arrow_forwardIs it possible to get the following from a set of experimental data: (a) r23 = 0.8, r13 = - 0.5, r12 = 0.6 %3D %3D %3D (b) r23 = 0.7, r13 = - 0.4, r12 = 0.6 %3D %3D %3Darrow_forwardPlasma etching is essential to the fine-line pattern transfer in current semiconductor processes. An article gives the accompanying data (read from a graph) on chlorine flow (x, in SCCM) through a nozzle used in the etching mechanism and etch rate (y, in 100 A/min). x 1.5 1.6 2.0 2.5 2.5 3.0 3.5 3.5 3.9 y 24.5 24.5 25.5 29.5 33.5 39.0 40.5 44.5 50.0 (a) Create a 99% two-sided confidence interval for the true average change in etch rate associated with a 1-SCCM increase in flow rate. (Round your answers to 3 decimal places, if needed.)(, )(b) Create a 99% two-sided confidence interval for the true average etch rate when flow is 3.5. (Round your answers to 3 decimal places, if needed.)Predicted value = Standard error = (, )(c) Create a 99% two-sided prediction interval for an etch rate when flow is 3.5. (Round your answers to 3 decimal places, if needed.)Predicted value = Standard error = (, )(d) Would the 95% CI and PI when flow is 2.5 be wider or narrower than the…arrow_forward
arrow_back_ios
SEE MORE QUESTIONS
arrow_forward_ios
Recommended textbooks for you
 Algebra & Trigonometry with Analytic GeometryAlgebraISBN:9781133382119Author:SwokowskiPublisher:Cengage
Algebra & Trigonometry with Analytic Geometry
Algebra
ISBN:9781133382119
Author:Swokowski
Publisher:Cengage
Correlation Vs Regression: Difference Between them with definition & Comparison Chart; Author: Key Differences;https://www.youtube.com/watch?v=Ou2QGSJVd0U;License: Standard YouTube License, CC-BY
Correlation and Regression: Concepts with Illustrative examples; Author: LEARN & APPLY : Lean and Six Sigma;https://www.youtube.com/watch?v=xTpHD5WLuoA;License: Standard YouTube License, CC-BY