
Videos
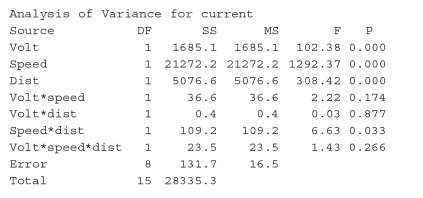
The accompanying data resulted from an experiment to study the nature of dependence of welding current on three factors: welding voltage, wire feed speed, and tip-to-workpiece distance. There were two levels of each factor (a 23 experiment) with two replications per combination of levels (the averages across replications agree with values given in the article “A Study on Prediction of Welding Current in Gas Metal Arc Welding,” J. Engr. Manuf., 1991: 64–69). The first two given numbers are for the treatment (1), the next two for a, and so on in standard order: 200.0, 204.2, 215.5, 219.5, 272.7, 276.9, 299.5, 302.7, 166.6, 172.6, 186.4, 192.0, 232.6, 240.8, 253.4, 261.6.
- a. Verify that the sums of squares are as given in the accompanying ANOVA table from Minitab.
- b. Which effects appear to be important, and why?

Trending nowThis is a popular solution!

Chapter 11 Solutions
Probability and Statistics for Engineering and the Sciences


- A data set from a study that examined the effect of a specific diet on blood pressure is provided . Participants (n = 72) were randomly assigned either to a group that was put on the diet (Diet = Present) or to a group that was not put on the diet (Diet = Absent), and researchers wanted to know whether the diet had a significant impact on blood pressure. Fully interpret the results in the context of this study (i.e., report the conclusions as related to the research question).arrow_forwardAn article described an experiment in which observations on various characteristics were made using minichambers of three different types: (1) cooler (PVC frames covered with shade cloth), (2) control (PVC frames only), and (3) warmer (PVC frames covered with plastic). One of the article's authors kindly supplied the accompanying data on the difference between air and soil temperatures (°C). Cooler Control Warmer 1.59 1.92 2.57 1.43 2.00 2.60 1.88 2.19 1.93 1.26 1.12 1.58 1.91 1.78 2.30 1.86 1.84 0.84 1.90 2.45 2.65 1.57 2.03 0.12 1.79 1.52 2.74 1.72 0.58 2.53 2.41 1.90 2.13 2.34 2.86 0.96 2.31 1.34 1.91 1.76 (a) Compare measures of center for the three different samples. Cooler=_____________ Control=____________ Warmer=____________ (b) Calculate the standard deviations for the three different samples. (Round your answers to three decimal places.) Coolers=_______________ Controls=______________ Warmers=______________…arrow_forwardStructural engineers use wireless sensor networks to monitor the condition of dams and bridges. The article "Statistical Analysis of Vibration Modes of a Suspension Bridge Using Spatially Dense Wireless Sensor Network" (S. Pakzad and G. Fenves, Journal of Structural Engineering, 2009:863-872) desaribes an experiment in which accelerometers were placed on the Golden Gate Bridge for the purpose of estimating vibration modes. For 18 vertical modes, the system was underdamped (damping ratio 1)? Explain why or why not f. e. For what damping ratio would you predict a frequency of 2.0?arrow_forward
- The article "Effect of Refrigeration on the Potassium Bitartrate Stability and Composition of Italian Wines" (A. Versari, D. Barbanti, et al., Italian Journal of Food Science, 2002:45- 52) reports a study in which eight types of white wine had their tartaric acid concentration (in g/L) measured both before and after a cold stabilization process. The results are presented in the following table: Wine Type Before After Difference 2.86 2.59 0.27 2.85 2.47 0.38 3 1.84 1.58 0.26 4 1.60 1.56 0.04 0.80 0.78 0.02 6. 0.89 0.66 0.23 2.03 1.87 0.16 1.90 1.71 0.19 Find a 95% confidence interval for the mean difference between the tartaric acid concentrations before and after the cold stabilization process.arrow_forwardThe degenerative disease osteoarthritis most frequently affects weight-bearing joints such as knee. The article “Evidence of Mechanical Load Redistribution at the Knee Joint in the Elderly when Ascending Stairs and Ramps” (Annals of Biomed. Engr., 2008:467-476) presented the following summary data on stance duration (ms) for samples of both older and younger adults. Age Sample Size Sample Mean Sample SD Older 28 801 117 Younger 16 780 72 Assume that both stance duration distributions are normal. Carry out a test of hypotheses at significance level .05 to decide whether true average stance duration is larger among elderly individuals than among younger individuals. (Population variances are not assumed equal.)arrow_forwardFoot ulcers are a common problem for people with diabetes. Higher skin temperatures on the foot indicate an increased risk of ulcers. The article "An Intelligent Insole for Diabetic Patients with the Loss of Protective Sensation" (Kimberly Anderson, M.S. Thesis, Colorado School of Mines), reports measurements of temperatures, in °F, of both feet for 181 diabetic patients. The results are presented in the following table. Left Foot Right Foot 80 80 85 85 75 80 88 86 89 87 87 82 78 78 88 89 89 90 76 81 89 86 87 82 78 78 80 81 87 82 86 85 76 80 88 89 Construct a scatterplot of the right foot temperature (y) versus the left foot temperature (x). Verify that a linear model is appropriate. b. Compute the least-squares line for predicting the right foot temperature from the left foot temperature. If the left foot temperatures of two patients differ by 2 degrees, by how much would you predict their right foot temperatures to differ? Predict the right foot temperature for a patient whose left…arrow_forward
 Linear Algebra: A Modern IntroductionAlgebraISBN:9781285463247Author:David PoolePublisher:Cengage Learning
 Calculus For The Life SciencesCalculusISBN:9780321964038Author:GREENWELL, Raymond N., RITCHEY, Nathan P., Lial, Margaret L.Publisher:Pearson Addison Wesley,
 Big Ideas Math A Bridge To Success Algebra 1: Stu...AlgebraISBN:9781680331141Author:HOUGHTON MIFFLIN HARCOURTPublisher:Houghton Mifflin Harcourt