
Concept explainers
Videos
Nickel titanium (NiTi) shape memory alloy (SMA) has been widely used in medical devices. This is attributable largely to the alloy’s shape memory effect (material returns to its original shape after heat deformation), superelasticity, and biocompatibility. An alloy element is usually coated on the surface of NiTi SMAs to prevent toxic Ni release.
The article “Parametrical Optimization of Laser Surface Alloyed NiTi Shape Memory Alloy with Co and Nb by the Taguchi Method” (J. of Engr. Manuf., 2012: 969–979) described an investigation to see whether the percent by weight of nickel in the alloyed layer is affected by carbon monoxide powder paste thickness (C, at three levels), scanning speed (B, at three levels), and laser power (A, at three levels). One observation was made at each factor-level combination [Note: Thickness column headings were incorrect in the cited article]:
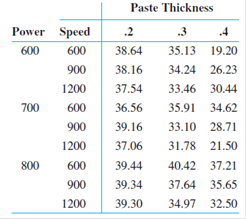
- a. Assuming the absence of three factor interactions (as did the investigators), SSE = SSABC can be used to obtain an estimate of σ2. Construct an ANOVA table based on this data.
- b. Use the appropriate F ratios to show that none of the two-factor interactions is significant at α = .05.
- c. Which main effects are significant at α =.05?
- d. Use Tukey’s procedure with a simultaneous confidence level of 95% to identify significant differences between levels of paste thickness.

Trending nowThis is a popular solution!

Chapter 11 Solutions
Probability and Statistics for Engineering and the Sciences


- The parameter “∆uv” helps to determine the colour balance of LiquidCrystal Display (LCD) panels on a manufacturing line. The targetvalue, upper and lower specification limits for the product are ∆uv =0.0000, ∆uv = 0.0200 and ∆uv = –0.0200 respectively, where ∆uv is aunitless parameter.Prior knowledge of the process provides evidence that ∆uv variesrandomly. Recent measurements at final test indicate that the meanvalue of ∆uv is –0.0027 and the standard deviation is 0.0057. 100,000 units of that LCD panel are produced, Calculate the number of panels that falls below, and the number of panels that falls above, the specification limitsarrow_forwardX X zy Section 5.4- QNT/275T: Statistics x + 598163/chapter/5/section/4 for Decision Making home > nce between two population means 4.1: Hypothesis test for the difference between two population means. Jump to level 1 A clinical researcher performs a clinical trial on 14 patients to determine whether a drug treatment has an effect on serum glucose. The sample mean glucose of the patients before and after the treatment are summarized in the following table. The sample standard deviation of the differences was 8. Before treatment What is the test statistic? Ex: 0.123 Check What type of hypothesis test should be performed? Select Select Left-tailed z-test Paired t-test Two-tailed z-test Unpaired t-test Next After treatment 75 Sample mean glucose (mg/dL) What is the number of degrees of freedom? Ex: 25 Does sufficient evidence exist to support the claim that the drug treatment has an effect on serum glucose at the a = 0.05 significance level? Select 81 MESA 81101 2 hp 3 Iarrow_forward2) Use Data Linearization technique to perform a fit in the form of y = (x^B)-¹ using the given data. x y 0.5 1.333 0.9 0.4115 0.333 1.5 0.231arrow_forward
- Special dyes have been developed that only bind to DNA. The intensity of the color is directly related to the quantity of DNA present in the cell. A haploid cell would have a “low” amount of color, a cell in G1 would have a “medium” amount of color, and a cell in M phase would have a “high” amount of color. Is this sort of assessment quantitative, qualitative or semi-quantitative? Justify your reasoning.arrow_forwardWhat is the significance of R and R2 in gression model?arrow_forwardi mathxl.com/Student/PlayerHomework.aspx?homeworkld=574125325&questionld3D1&flushed%3false&cld%3D6161404¢erwin=yes T'Mara Gilchrist &I 10/0: O Do Homework - T'Mara Gilchrist- Google Chrome Mat 122 - 80 Fall 2020 Homework: Section 6.2 Homework HW Score: ( 6 of 10 (0 complete) ▼ Score: 0 of 1 pt E Quest 6.2.21 Construct a truth table for the following compound statement. (-qv -r)A (- s v- q) Fill in the truth table for (- qv -r) A (-sv- q) line by line. (-qv-r) A (-s V – q) Enter your answer in the answer box and then click Check Answer. 7 parts remaining Terms of Use Privacy Policy Copyright 2020 Pearson Education Inc. All Rights Reserved. Clear All 梦 $ a.arrow_forward
- A sociologist investigating the recent upward shift in homicide trends throughout the country studied the extent to which the homicide rate per 100 000 people (v) is associated with population size in thousands (x ), the rate of unemployment (x,), and the percentage of families with annual incomes less than R24 000 (x3). Data are provided in the table for a sample of 20 cities. A regression analysis was performed on the data and the results indicated that the interaction model E(y) = B,+ Bx + Bx, + Bx; + B,xqx,+ B;xx; + Bzxzx; was a good model to fit to the data. %3D However, the residual plot for this model indicates that heteroscedasticity may exists for the percentage of families with annual incomes less than R24 000. How do I Conduct a test for heteroscedasticity by dividing the data into two subsamples, x,21 and x, > 21 using MSE for the first subsample = 582.3, MSE for the second subsample = 364.7 and a= 0.05. And how do I explain my conclusion.arrow_forwardUse least squares regression to fit polynomials of order 1, 3 and 5 to the data given in table. Compute the correlation coefficient for each fit (Use Gauss elimination with partial pivoting in the solution of linear equation systems). Plot 1st, 3rd, and 5th order polynomial fits and the given discrete data. Comment on which of these curves explain better the variability of given data. I have a solution at second image but i dont understand where did the functions like "y=2.3021x^3+..." come from? I need a detailed description about it. Thank youarrow_forwardA new bandage has been developed that is thought to aid in the healing of small cuts. The bandage has special air circulation holes as well as antiseptic within the bandage pad. Controlled one centimeter cuts in volunteers were completely healed in an average of 11 days utilizing the old bandage. Below are the healing times for similar cuts utilizing the new bandage. Did the new bandage significantly reduce healing times? Analyze both parametrically and nonparametrically (with both the sign test and Wilcoxon signed-rank test). 9.5, 9.7,10.5, 10.2, 10.8, 10.9, 10.1, 11.3, 9.9, 9.6, 11.2, 11.0, 10.0, 10.4, 11.4, 9.8arrow_forward
- Recently there has been increased use of stainless steel claddings in industrial settings. Claddings are used to finish the exterior walls of a building and help weatherproof the structure. To ensure the quality of claddings, it is essential to know how welding parameters impact the cladding process. The authors of “Mathematical Modeling of Weld Bead Geometry, Quality, and Productivity for Stainless Steel Claddings Deposited by FCAW” (J. Mater. Engr. Perform., 2012: 1862–1872) in vestigated how y 5 deposition rate was influenced by x1 = feed rate (Wf , in m/min) and x2 = welding speed (S, in cm/min). The following 22 observations correspond to the experiment condition where applied voltage was less than 30v: y: 2.718 3.881 2.773 3.924 2.740 3.870 x1 : 17.0 10.0 7.0 10.0 7.0 10.0 x 2 : 30 30 50 50 30 30 y: 2.847 3.901 2.204 4.454 3.324 3.319 x1 : 7.0 10.0 5.5 11.5 8.5 8.5 x2 : 50 50 40 40 40 20 The whole data and Question parts are attachedarrow_forwardCompute the relative efficiency of this design over RCBD.arrow_forwardConsider the following population model for household consumption: cons = a + b1 * inc+ b2 * educ+ b3 * hhsize + u where cons is consumption, inc is income, educ is the education level of household head, hhsize is the size of a household. Suppose a researcher estimates the model and gets the predicted value, cons_hat, and then runs a regression of cons_hat on educ, inc, and hhsize. Which of the following choice is correct and please explain why. A) be certain that R^2 = 1 B) be certain that R^2 = 0 C) be certain that R^2 is less than 1 but greater than 0. D) not be certainarrow_forward
 MATLAB: An Introduction with ApplicationsStatisticsISBN:9781119256830Author:Amos GilatPublisher:John Wiley & Sons Inc
 Probability and Statistics for Engineering and th...StatisticsISBN:9781305251809Author:Jay L. DevorePublisher:Cengage Learning
 Statistics for The Behavioral Sciences (MindTap C...StatisticsISBN:9781305504912Author:Frederick J Gravetter, Larry B. WallnauPublisher:Cengage Learning
 Elementary Statistics: Picturing the World (7th E...StatisticsISBN:9780134683416Author:Ron Larson, Betsy FarberPublisher:PEARSON
 The Basic Practice of StatisticsStatisticsISBN:9781319042578Author:David S. Moore, William I. Notz, Michael A. FlignerPublisher:W. H. Freeman
 Introduction to the Practice of StatisticsStatisticsISBN:9781319013387Author:David S. Moore, George P. McCabe, Bruce A. CraigPublisher:W. H. Freeman