
Videos
Analyze and compare Costco, Wal-Mart, and Nordstrom
The general merchandise retail industry has a number of segments represented by the following companies:
| Company Name | Merchandise Concept |
| Costco Wholesale Corporation (COST) | Membership warehouse |
| Wal-Mart Stores, Inc. (WMT) | Discount general merchandise |
| Nordstrom, Inc. (JWN) | Fashion department store |
For a recent war, the following cost of goods sold and beginning and ending inventories are provided from corporate annual reports (in millions) for these three companies:
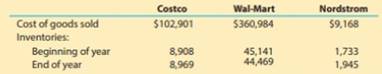
- a. Determine the inventory turnover ratio for all three companies. Round all calculations to one decimal place.
- b. Determine the number of days’ sales in inventory for all three companies. Use 365 days and round all calculations to one decimal place.
- c.
 Interpret these results based on each company’s merchandising concept.
(a)
Inventory turnover ratio: Inventory turnover ratio is used to determine the number of times inventory used or sold during the particular accounting period. The formula to calculate the inventory turnover ratio is as follows:
To determine: the inventory turnover for Company C, Company W and Company N
Answer to Problem 6.3MAD
Explanation of Solution
The inventory turnover ratio for Company C is calculated as follows:
Working notes:
The average inventory is calculated as follows:
The inventory turnover ratio for Company W is calculated as follows:
Working notes:
The average inventory is calculated as follows:
The inventory turnover ratio for Company N is calculated as follows:
Working notes:
The average inventory is calculated as follows:
The inventory turnover of Company C is 11.5 Times, the inventory turnover of Company W is 8 Times and the inventory turnover of Company N is 5 Times.
(b)
Days’ sales in inventory: Days’ sales in inventory are used to determine number of days a particular company takes to make sales of the inventory available with them. The formula to calculate the days’ sales in inventory ratio is as follows:
To determine: the Days’ sales in inventory ratio for Company C, Company W and Company N.
Answer to Problem 6.3MAD
Explanation of Solution
The Days’ sale in inventory ratio for Company C is calculated as follows:
The Days’ sale in inventory ratio for Company W is calculated as follows:
The Days’ sale in inventory ratio for Company N is calculated as follows:
The Days’ sales in inventory of Company C is 31.7 days, the Days’ sales in inventory of Company W is 45.6 days, & the Days’ sales in inventory of Company N is 73 days.
(c)
Inventory turnover ratio: Inventory turnover ratio is used to determine the number of times inventory used or sold during the particular accounting period. The formula to calculate the inventory turnover ratio is as follows:
Days’ sales in inventory: Days’ sales in inventory are used to determine number of days a particular company takes to make sales of the inventory available with them. The formula to calculate the days’ sales in inventory ratio is as follows:
To interpret: the above calculated ratios.
Explanation of Solution
The inventory turnover ratio and number of days’ sales in inventory of all the three companies reflect the merchandising approaches of all companies. Company C is a club warehouse and it has approach of holding only items which are quickly sold. Most of the items are sold in bulk at very attractive prices.
In case of company W, it has a traditional discounter approach. Even though it has attractive pricing, the inventory movement is slower than in the case of company C.
In the case of company N, it is a high-end fashioner retailer. It offers a wide collection of specialty and unique goods that are specifically designed for fashion market rather than for general mass market. Therefore, the movement is slower than other two companies yet it has highest margin.
Want to see more full solutions like this?
Chapter 6 Solutions
Corporate Financial Accounting


- Amazon.com, Inc. (AMZN) is one of the largest Internet retailers in the world. Target Corporation (TGT) is one of the largest value-priced general merchandisers operating in the United States. Target sells through nearly 1,800 brick-and-mortar stores and through the Internet. Amazon and Target compete for customers across a wide variety of products, including media, general merchandise, apparel, and consumer electronics. Cost of goods sold and inventory information from a recent annual report are provided for both companies as follows (in millions): a. Compute the inventory turnover for both companies. Round all calculations to one decimal place. b. Compute the number of days sales in inventory for both companies. Use 365 days and round all calculations to one decimal place. c. Which company has the better inventory efficiency? d. What might explain the difference in inventory efficiency between the two companies?arrow_forwardUse the following data for Exercises E16-16, E16-17, and E16-18. Selected data for three companies are given below. All inventory amounts are ending balances and all amounts are in millions. Identifying differences between service, merchandising, and manufacturing companies Using the data on the previous page, calculate operating income for each company.arrow_forwardUse the following data for Exercises E16-16, E16-17, and E16-18. Selected data for three companies are given below. All inventory amounts are ending balances and all amounts are in millions. Identifying differences between service, merchandising, and manufacturing companies Using the data on the previous page, calculate total current assets for each company.arrow_forward
- Use the following data for Exercises E16-16, E16-17, and E16-18. Selected data for three companies are given below. All inventory amounts are ending balances and all amounts are in millions. Identifying differences between service, merchandising, and manufacturing companies Using the above data, determine the company type. Identify each company as a service company, merchandising company, or manufacturing company.arrow_forwardRequired information [The following information applies to the questions displayed below.] Use the following selected account balances of Delray Manufacturing for the year ended December 31. Sales Raw materials inventory, beginning Work in process inventory, beginning Finished goods inventory, beginning Raw materials purchases. Direct labor Indirect labor Repairs-Factory equipment Rent cost of factory building Selling expenses General and administrative expenses Raw materials inventory, ending Work in process inventory, ending Finished goods inventory, ending $ 2,700,000 112,000 146,000 190,000 515,000 618,000. 93,000 74,000 148,000 237,000 379,000 134,000 175,000 228,000 Prepare an income statement for Delray Manufacturing (a manufacturer). Assume that its cost of goods manufactured is $1,397,00arrow_forwardThe following revenue data were taken from the December 31, 2017, General Electric annual report (10-K): For each segment and each year, calculate intersegment sales (another name for transfer sales) as a percentage of total sales. Using Microsoft Excel or another spreadsheet application, create a clustered column graph to show the 2016 and 2017 percentages for each division. Comment on your observations of this data. How might a division sales manager use this data?arrow_forward
- Monster Beverage Corporation (MNST) develops, markets, and sells energy and other alternative beverage brands. Brown-Forman Corporation (BF.B) manufactures and sells a wide variety of spirit and wine beverages, such as Jack Daniels. The cost of goods sold and inventory were obtained from a recent annual report for both companies as follows (in millions): a. Determine the inventory turnover for both companies. Round all calculations to one decimal place. b. Determine the number of days sales in inventory for both companies. Use 365 days and round all calculations to one decimal place. c. Interpret the difference in inventory efficiency based on the companies respective product types.arrow_forwardCustomers as a Cost Object Morrisom National Bank has requested an analysis of checking account profitability by customer type. Customers are categorized according to the size of their account: low balances, medium balances, and high balances. The activities associated with the three different customer categories and their associated annual costs are as follows: Additional data concerning the usage of the activities by the various customers are also provided: Required: (Note: Round answers to two decimal places.) 1. Calculate a cost per account per year by dividing the total cost of processing and maintaining checking accounts by the total number of accounts. What is the average fee per month that the bank should charge to cover the costs incurred because of checking accounts? 2. Calculate a cost per account by customer category by using activity rates. 3. Currently, the bank offers free checking to all of its customers. The interest revenues average 90 per account; however, the interest revenues earned per account by category are 80, 100, and 165 for the low-, medium-, and high-balance accounts, respectively. Calculate the average profit per account (average revenue minus average cost from Requirement 1). Then calculate the profit per account by using the revenue per customer type and the unit cost per customer type calculated in Requirement 2. 4. CONCEPTUAL CONNECTION After the analysis in Requirement 3, a vice president recommended eliminating the free checking feature for low-balance customers. The bank president expressed reluctance to do so, arguing that the low-balance customers more than made up for the loss through cross-sales. He presented a survey that showed that 50% of the customers would switch banks if a checking fee were imposed. Explain how you could verify the presidents argument by using ABC.arrow_forwardGolden Eagle Company began operations on April 1 by selling a single product. Data on purchases and sales for the year are as follows: Purchases: Sales: The president of the company, Connie Kilmer, has asked for your advice on which inventory cost flow method should be used for the 32,000-unit physical inventory that was taken on December 31. The company plans to expand its product line in the future and uses the periodic inventory system. Write a brief memo to Ms. Kilmer comparing and contrasting the LIFO and FIFO inventory cost flow methods and their potential impacts on the companys financial statements.arrow_forward
- The following revenue data were taken from the December 31, 2017, Coca-Cola annual report (10-K): For each segment and each year, calculate intersegment sales (another name for transfer sales) as a percentage of total sales, Using Microsoft Excel or another spreadsheet application, create a clustered column graph to show the 2016 and 2017 percentages for each division. Comment on your observations of this data. How might a division sales manager use this data?arrow_forwardCalculate the goods available for sale for Atlantis Company, in units and in dollar amounts, given the following facts about their inventory for the period:arrow_forwardThe following information is from Daves Sporting Goods. Daves is a Midwest sporting goods store with three regional stores. The August income statement for all stores is shown. A. Comment on the operating income results for each store. B. Now assume the costs allocated from corporate is an uncontrollable cost for each store. How does this change your assessment of each store?arrow_forward
 Financial And Managerial AccountingAccountingISBN:9781337902663Author:WARREN, Carl S.Publisher:Cengage Learning,
 Financial AccountingAccountingISBN:9781305088436Author:Carl Warren, Jim Reeve, Jonathan DuchacPublisher:Cengage Learning
 Financial AccountingAccountingISBN:9781337272124Author:Carl Warren, James M. Reeve, Jonathan DuchacPublisher:Cengage Learning
 Managerial Accounting: The Cornerstone of Busines...AccountingISBN:9781337115773Author:Maryanne M. Mowen, Don R. Hansen, Dan L. HeitgerPublisher:Cengage Learning