
Videos
The following revenue data were taken from the December 31, 2017, Coca-Cola annual report (10-K):
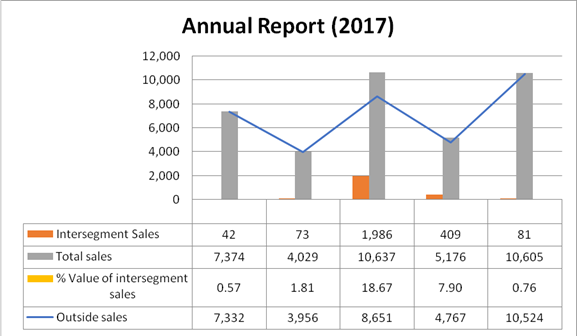
For each segment and each year, calculate intersegment sales (another name for transfer sales) as a percentage of total sales, Using Microsoft Excel or another spreadsheet application, create a clustered column graph to show the 2016 and 2017 percentages for each division. Comment on your observations of this data. How might a division sales manager use this data?
Want to see the full answer?
Check out a sample textbook solution
Chapter 9 Solutions
Principles of Accounting Volume 2
Additional Business Textbook Solutions
Financial Accounting, Student Value Edition (5th Edition)
Construction Accounting And Financial Management (4th Edition)
Financial Accounting, Student Value Edition (4th Edition)
Managerial Accounting (5th Edition)
Horngren's Financial & Managerial Accounting, The Financial Chapters (6th Edition)
Financial Accounting (12th Edition) (What's New in Accounting)


- The following revenue data were taken from the December 31, 2017, General Electric annual report (10-K): For each segment and each year, calculate intersegment sales (another name for transfer sales) as a percentage of total sales. Using Microsoft Excel or another spreadsheet application, create a clustered column graph to show the 2016 and 2017 percentages for each division. Comment on your observations of this data. How might a division sales manager use this data?arrow_forwardPlease see the picture below. I need help making a retained earnings statement, a balance statement, a comprehensive income statement and calculate the profit margin and the gross profit rate for the income statement I've included. Note that I have included the Income statement below. Note that I have included all the information that was made available to me. I need this asap. Big John's Merch Income statement For the month ending February 28, 2022 Sales - $50,000 Costs of goods sold- $12,500 Operating expenses Salaries- $2,500 Rent- $800 Advertising- $500 Depreciation- $300 Utilities- $75 Revenues and Expenses Internet revenues- $2,000 Internet expense- $150 Insurance expense- $400 Other revenues- $3,500arrow_forwardThe following is select account information for August Sundries. Sales: $850,360; Sales Returns and Allowances: $148,550; COGS: $300,840; Operating Expenses: $45,770; Sales Discounts: $231,820. If August Sundries uses a multi-step income statement format, what is their gross margin?arrow_forward
- With the information provided in the image: Prepare a multi-step income statement. Calculate the company's return on sales ratio.arrow_forwardPrepare a basic income statement forecast for the subsequent fiscal year, using a percentage of sales approach and using information included in the materials below to support assumptions that correspond for each revenue and expense. Each line item (e.g., marketing expenses) should have a note and an explanation on how it was calculated.arrow_forwardUse the following selected data from Business Solutions's income statement for the three months ended March 31, 2022, and from its March 31, 2022, balance sheet to complete the requirements. Computer services revenue Net sales (of goods) Total sales and revenue Cost of goods sold Net income Quick assets Current assets Total assets Current liabilities Total liabilities. Total equity Required 1 Required: 1. Compute the gross margin ratio (both with and without services revenue) and net profit margin ratio. 2. Compute the current ratio and acid-test ratio. 3. Compute the debt ratio and equity ratio. 4. What percent of its assets are current? What percent are long term? Required 2 Required 3 $ 27,912 19,428 47,340 13,820 Complete this question by entering your answers in the tabs below. 19,716 89,940 95,224 118,824 Gross margin ratio Net profit margin ratio 1,110 1,110 117,714 % % Compute the gross margin ratio (both with and without services revenue) and net profit margin ratio. Note:…arrow_forward
- The accounting information collected from the MCM company is detailed in the attached tables. Prepare the following:a-General Balance as of September 30, 2010b- Statement of the cost of goods sold for the month of September 2010c-Income statement for the month of September 2010d-Calculate the following financial ratios: Current ratio, acid test ratio, participation ratio, profit margin. Financial information was collected for the month of September 210 for the company MCM. Balance Bills to pay $35000 receivable accounts $29000 bonds payable $110000 buildings (net value) $605000 cash on hand $17000 dividends payable $8000 inventary $31000 terrain $450000 long-term mortgage payable $450000 retained earnings $154000 stock values $375000 transaction in september 2010 category Amount workforce $50000 bills insurance $20000 sales $62000 rent and maintenance $40000 salary $110000 others $62000 total $294000…arrow_forwardHere is the operating data for Yalis Cleaning, Inc.: After analyzing the transactions, prepare a vertical analysis schedule for the company for 2021 and 2020 using service revenue as the base amount. Round percentages to two decimal places.arrow_forwardSummary operating data for Custom Wire & Tubing Company during the year ended April 30, 2018, are as follows: cost of goods sold, $510,700; administrative expenses, $63,600; interest expense, $38,000; rent revenue, $127,200; sales, $826,800; and selling expenses, $95,400. Prepare a single-step income statement. Custom Wire & Tubing Company Income Statement For the Year Ended April 30, 2018 Revenues: $ Total revenues $ Expenses: $ Total expenses $arrow_forward
- Requirements 1. Prepare the company's January, multistep income statement. Calculate income using the LIFO, average-cost, and FIFO methods. Label the bottom line "Operating income." Round the average cost per unit to three decimal places and all other figures to whole-dollar amounts. Show your computations. 2. Suppose you are the financial vice president of Ohio Instruments. Which inventory method will you use if your motive is to a. minimize income taxes? b. report the highest operating income? c. report operating income between the extremes of FIFO and LIFO? d. report inventory on the balance sheet at the most current cost? e. attain the best measure of net income for the income statemehi? State the reason for each of your answers. please answer all please answer all or skip do not waste question or time by giving incomplete or incorrect answer please provide answer with explanation computation formula please answer with steps thanksarrow_forwardYour Task… Using your assigned financial statements calculate the required ratios below Indicate if the change from year to year is favorable or unfavorable. All values should be accurate to at least two decimal places. The expectation is to submit a professional report free of grammar and spelling errors and easy to read. Think of this as a menu you would be handing to a customer. All calculations are to be represented. Analysis of Profitability Gross Profit Ratio Operating Profit Ratio Net Profit Ratio Sales to Total Assets Ratio Return on Total Assets Return on Equity Earnings Per Sharearrow_forwardFor 2014, Kasay Company initiated a sales promotion campaign that included the expenditure of an additional $30,000 for advertising. At the end of the year, Scott Brown, the president, is presented with the following condensed comparative income statement: Instructions1. Prepare a comparative income statement for the two-year period, presenting an analysis of each item in relationship to net sales for each of the years. Round to one decimal place.2. To the extent the data permit, comment on the significant relationships revealed by the vertical analysis prepared in(1).arrow_forward
 Principles of Accounting Volume 2AccountingISBN:9781947172609Author:OpenStaxPublisher:OpenStax CollegePrinciples of Accounting Volume 1AccountingISBN:9781947172685Author:OpenStaxPublisher:OpenStax College
 Managerial AccountingAccountingISBN:9781337912020Author:Carl Warren, Ph.d. Cma William B. TaylerPublisher:South-Western College Pub
 College Accounting, Chapters 1-27AccountingISBN:9781337794756Author:HEINTZ, James A.Publisher:Cengage Learning,
 Cornerstones of Cost Management (Cornerstones Ser...AccountingISBN:9781305970663Author:Don R. Hansen, Maryanne M. MowenPublisher:Cengage Learning