
Concept explainers
Videos
To review:
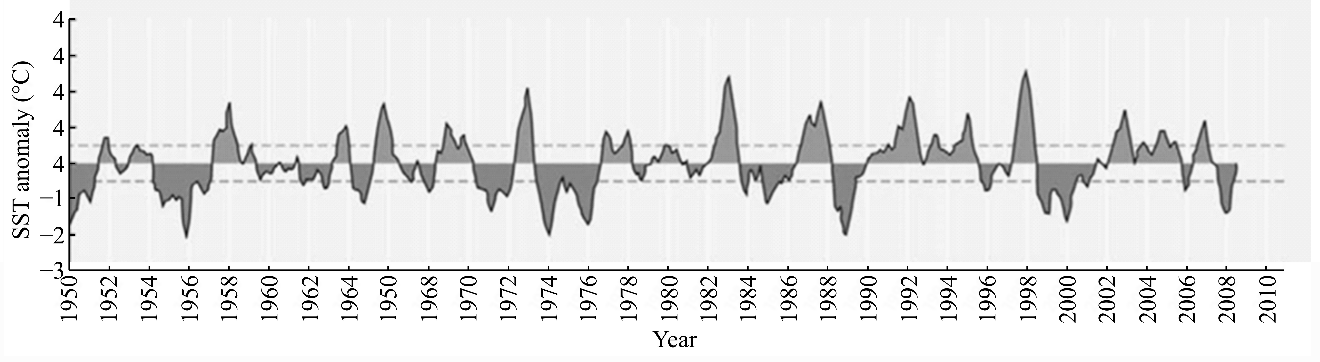
The number of times the seas surface temperatures (SST) have predicted the occurrence of El Nino or La Nina from the given data for all the years shown.
Introduction:
El Nino is a Southern oceanic phenomenon that occurs on the western coast of South America and the east coast of Australia, usually around the time of Christmas. The ocean water warms up by a change in the wind direction, and the warm water is pushed towards the western coast of South America. As a result of this, the anchovy fish die, and thus, the food chain is disrupted. The birds that feed on these fishes and whose dung (guano) is a source of fertilizer, also decline in number. Thus, the overall economy of Peru, Ecuador, and Chile suffer upon the arrival of El Nino. The reverse condition of El Nino is called La Nina.
Want to see the full answer?
Check out a sample textbook solution
Chapter 51 Solutions
Biology: The Dynamic Science (MindTap Course List)


- Climate is the result of a variety of global processes. What of the following is a climatological driver? rotation of Earth hydrosphere properties oceanic currents concertation of sun irradiances all of the abovearrow_forwardWhat are 3 main pros and 3 main cons of climate change ? And explain why they are pros and cons.arrow_forwardExplain why you chose A or B, etc. Provide a logical explanation defending your answer choice. Q: Which of the following statements is false about the impacts of climate change? Choose all that apply. Group of answer choices A) A drought- and heat-induced increase of wildfires can have continent-wide impacts on human health B) Lower temperatures in some areas and at certain times are expected due to disruption in typical weather patterns. C) An increase in land conversion from natural habitats to developed or agriculture can reduce the zoonotic potential of diseases D) In the US, increased temperatures disproportionately affect the health of marginalized communities The conditions brought about by climate change may actually benefit agricultural productivity Q: "Unless someone like ________ cares a whole awful lot, nothing is going to get better. It's not." - Dr. Seuss Group of answer choices A) the CEOs of major corporations B) the government C) you D)…arrow_forward
- The warming trends discussed in the Case Study are most pronounced at the equator, where sunlight is most direct. What would you predict the effect of global warming to be nearer the poles, where temperatures are lower and there is less sunlight?arrow_forwardWhich of the following statements about atmospheric carbon dioxide levels is correct? For about 800,000 years prior to human influence it varied between 180 and 300 ppm and is now above 410 ppm. For about 800,000 years prior to human influence it never exceeded 200 ppm. Its rate of increase in the past century is greater than any seen in the ice core record. Both 1 & 3arrow_forwardThe graph shows that the atmosphere is currently warmer than it has been in Global Mean Temperature over Land & Ocean 0.6 0.4 0.2 0.0 -0.2 -0.4 -0.6 L 1 1940 1920 1960 anomaly ("C) relative to 1961-1990 1880 1900 O 100 years O 1,000 years O 120 years O 1,200 years year ↓ L 1980 2000arrow_forward
- Why do you think eruptions of volcanoes like Mt. Pinatubo might have a cooling effect on the Earth’s surface?arrow_forwardWhat geopolitical problems does northwestern Europe face today and what solutions have been proposedarrow_forwardWhat are the impact of climate changd in meteorological pattern?arrow_forward
- The graph illustrates the temperature and precipitation conditions in various terrestrial biomes. a) Based on the information in the graph, describe the air temperature range for a boreal forest. (b) Based on the information in the graph, identify the major grassland present within 20 degrees north and south of the equator.arrow_forwardGenerally speaking, where deserts and rainforest are located globally? How is this distribution tied to patterns in precipitation?arrow_forwardThis is the Keeling Curve, the record of atmospheric CO2 as measured at Mauna Loa, Hawaii, over the last several decades. What do the small oscillations in this curve reflect? November 18, 2021 Carbon dioxide concentration at Mauna Loa Observatory 420 410 Full Record ending November 18, 2021 400 390 380 370 360 350 340 8 330 320 310 1960 2000 1965 1970 1975 1980 1985 1990 1995 2005 2010 2015 2020 O a. The change in the direction of ocean breezes over Hawaii b. Annual cycles, driven by the seasonal pattern of photosynthesis in the Northern Hemisphere O c. The episodic outgassing of the Mauna Loa volcano where the observatory is located d. Annual cycles, driven by CO2 incorporation into glaciers in winter Co, Concentration (ppm)arrow_forward
 Human Anatomy & Physiology (11th Edition)BiologyISBN:9780134580999Author:Elaine N. Marieb, Katja N. HoehnPublisher:PEARSON
 Biology 2eBiologyISBN:9781947172517Author:Matthew Douglas, Jung Choi, Mary Ann ClarkPublisher:OpenStax
 Anatomy & PhysiologyBiologyISBN:9781259398629Author:McKinley, Michael P., O'loughlin, Valerie Dean, Bidle, Theresa StouterPublisher:Mcgraw Hill Education,
 Molecular Biology of the Cell (Sixth Edition)BiologyISBN:9780815344322Author:Bruce Alberts, Alexander D. Johnson, Julian Lewis, David Morgan, Martin Raff, Keith Roberts, Peter WalterPublisher:W. W. Norton & Company
 Laboratory Manual For Human Anatomy & PhysiologyBiologyISBN:9781260159363Author:Martin, Terry R., Prentice-craver, CynthiaPublisher:McGraw-Hill Publishing Co.
 Inquiry Into Life (16th Edition)BiologyISBN:9781260231700Author:Sylvia S. Mader, Michael WindelspechtPublisher:McGraw Hill Education