
Concept explainers
Videos
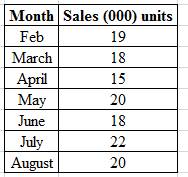
National Scan, Inc., sells radio frequency inventory tags. Monthly sales for a seven-month period were as follows:
| Month | Sales (000 units) |
| Feb. | 19 |
| Mar. | 18 |
| Apr. | 15 |
| May | 20 |
| Jun. | 18 |
| Jul. | 22 |
| Aug. | 20 |
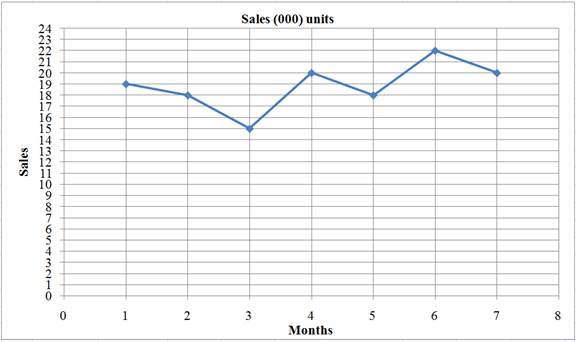
a. Plot the monthly data on a sheet of graph paper.
b.
(1) The naive approach
(2) A five month moving average
(3) A weighted average using .60 for August, .30 for July, and .10 for June
(4) Exponential smoothing with a smoothing constant equal to .20, assuming a a March forecast of 19(000)
(5) A linear trend equation
c. Which method seems least appropriate Why? (Hint: Refer to your plot from part a.)
d. What does use of the term sales rather than demand presume?
a)
To plot: The monthly data on a sheet of graph paper.
Introduction: Forecasting is the planning process that helps to predict the future aspects of the business or operation using present or past data. It uses certain assumptions based the knowledge and experience of the management.
Explanation of Solution
Given information:
The monthly sales data of RF tags for a seven-month period is given as shown below:
Plot the monthly data on a graph with Sales on the Y axis and months on the X-axis as shown below:
b)
To determine: The forecast for September sales using the following approaches.
Introduction: Forecasting is the planning process that helps to predict the future aspects of the business or operation using present or past data. It uses certain assumptions based the knowledge and experience of the management.
Explanation of Solution
- 1) Forecast the September sales using the naïve approach as shown below:
The forecast for the month of September as per the naïve approach, will be the same as the sales for the month of August, which is 20,000 units of sales.
- 2) Calculate the forecast for the month of September using a five-month period moving average as shown below:
Substitute in the above equation the values of
- 3) Calculate the forecast for September using the weighted average method, where the weights are 0.60 for August, 0.30 for July and 0.10 for June as shown below:
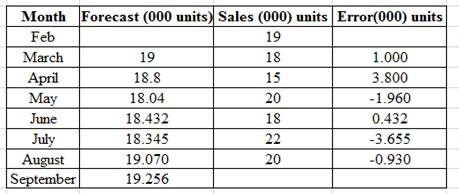
- 4) To compute the forecast using an exponential smoothing constant α equal to 0.20 and assuming a March forecast of 19,000 units, first calculate the forecasts for the months of March, April, May, June, July and August as shown below:
Given that the March actual was 18,000 units and the forecast was 19,000 units, the error in the forecast was 1,000 units. Therefore, the forecast for the month of April would be as follows:
Given that the April actual was 15,000 units and the forecast was 18,800 units, the error in the April forecast was 3,800 units. Therefore, the forecast for the month of May would be as follows:
Given that the May actual was 20,000 units and the forecast was 18,040 units, the error in the May forecast was 1,960 units. Therefore, the forecast for the month of June would be as follows:
Given that the June actual was 18,000 units and the forecast was 18,432 units, the error in the June forecast was 432 units. Therefore, the forecast for the month of July would be as follows:
Given that the July actual was 22,000 units and the forecast was 18,345 units, the error in the July forecast was 3,655 units. Therefore, the forecast for the month of August would be as follows:
Given that the August actual was 20,000 units and the forecast was 19,070 units, the error in the August forecast was 930 units. Therefore, the forecast for the month of September would be as follows:
Therefore, the forecast for the month of September using exponential smoothing would be 19,256 units.
Summarize the above calculations in a table as shown below:
5) Calculate the forecast for September using linear trend equation:
A linear trend equation for the monthly sales using Microsoft Excelis graphically shown below:
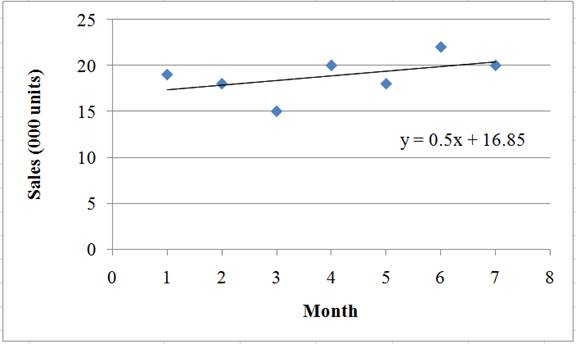
Substitute the value of
The forecast sales in September works out to be 20,857 units.
c)
To determine: The method which seems to least appropriate.
Introduction: Forecasting is the planning process that helps to predict the future aspects of the business or operation using present or past data. It uses certain assumptions based the knowledge and experience of the management.
Explanation of Solution
Among the five approaches calculated above, the linear trend approach seems to be the least appropriate. The equation
d)
To determine: The use of the term sales rather than demand presume.
Introduction: Forecasting is the planning process that helps to predict the future aspects of the business or operation using present or past data. It uses certain assumptions based the knowledge and experience of the management.
Explanation of Solution
When the term sales is used for demand, it is presumed that there are no stock-outs. In other words, in every month the sales were the same as demand figures.
Want to see more full solutions like this?
Chapter 3 Solutions
Operations Management
Additional Business Textbook Solutions
Principles of Operations Management: Sustainability and Supply Chain Management (10th Edition)
Business in Action (8th Edition)
Operations Management, Binder Ready Version: An Integrated Approach
Operations Management: Processes and Supply Chains (12th Edition) (What's New in Operations Management)
Principles Of Operations Management
Operations Management: Sustainability and Supply Chain Management (12th Edition)


- Under what conditions might a firm use multiple forecasting methods?arrow_forwardThe file P13_42.xlsx contains monthly data on consumer revolving credit (in millions of dollars) through credit unions. a. Use these data to forecast consumer revolving credit through credit unions for the next 12 months. Do it in two ways. First, fit an exponential trend to the series. Second, use Holts method with optimized smoothing constants. b. Which of these two methods appears to provide the best forecasts? Answer by comparing their MAPE values.arrow_forwardThe file P13_22.xlsx contains total monthly U.S. retail sales data. While holding out the final six months of observations for validation purposes, use the method of moving averages with a carefully chosen span to forecast U.S. retail sales in the next year. Comment on the performance of your model. What makes this time series more challenging to forecast?arrow_forward
- The Baker Company wants to develop a budget to predict how overhead costs vary with activity levels. Management is trying to decide whether direct labor hours (DLH) or units produced is the better measure of activity for the firm. Monthly data for the preceding 24 months appear in the file P13_40.xlsx. Use regression analysis to determine which measure, DLH or Units (or both), should be used for the budget. How would the regression equation be used to obtain the budget for the firms overhead costs?arrow_forwardThe file P13_26.xlsx contains the monthly number of airline tickets sold by the CareFree Travel Agency. a. Create a time series chart of the data. Based on what you see, which of the exponential smoothing models do you think will provide the best forecasting model? Why? b. Use simple exponential smoothing to forecast these data, using a smoothing constant of 0.1. c. Repeat part b, but search for the smoothing constant that makes RMSE as small as possible. Does it make much of an improvement over the model in part b?arrow_forward4.4 A check-processing center uses exponential smooth- ing to forecast the number of incoming checks each month. The number of checks received in June was 40 million, while the fore- cast was 42 million. A smoothing constant of .2 is used. a) What is the forecast for July? b) If the center received 45 million checks in July, what would be the forecast for August? c) Why might this be an inappropriate forecasting method for this situation? Px .. 4.5 The Carbondale Hospital is considering the purchase of a new ambulance. The decision will rest partly on the antici- pated mileage to be driven next year. The miles driven during the past 5 years are as follows: YEAR 1 2 3 4 5 a) Forecast the mileage for next year (6th year) using a 2-year moving average. b) Find the MAD based on the 2-year moving average. (Hint: You will have only 3 years of matched data.) c) Use a weighted 2-year moving average with weights of 4 and .6 to forecast next year's mileage. (The weight of .6 is for the most…arrow_forward
- Handy, Inc., produces a solar-powered electronic calculator that has experiencedthe following monthly sales history for the first four months of the year, inthousands of units:January 23.3 March 30.3February 72.3 April 15.5a. If the forecast for January was 25, determine the one-step-ahead forecasts forFebruary through May using exponential smoothing with a smoothing constant of a=.15.b. Repeat the calculation in part (a) for a value of a= .40. What difference in theforecasts do you observe?c. Compute the MSEs for the forecasts you obtained in parts (a) and (b) forFebruary through April. Which value of a gave more accurate forecasts, basedon the MSE?arrow_forwardThe monthly sales for Yazici Batteries, Inc., wereas follows: a) Plot the monthly sales data.b) Forecast January sales using each of the following:i) Naive method.ii) A 3-month moving average.iii) A 6-month weighted average using .1, .1, .1, .2, .2, and.3, with the heaviest weights applied to the most recentmonths.iv) Exponential smoothing using an a = .3 and aSeptember forecast of 18.v) A trend projection.c) With the data given, which method would allow you toforecast next March’s sales?arrow_forward3. A mobile phone store owner wants to predict the demand for mobile phones in October based on the following historical sales data: Month- April May June. July August September Number of phones sold. 100, 140- 110. 150. 120. 160- a. What is this month's forecast using Naive approach b. Using 3-Month Moving Average, develop forecasts for October's demand c. Using 5-Month Moving Average, develop forecasts for October's demand d. When making moving average forecasts, is it better to use a larger time span? -arrow_forward
- „. Choose the type of forecasting techniques (Survey, Delphi, Averages, Seasonal, Naive, Trend or Causal) a. Demand for Mother's day greeting cards b. Popularity of new television series c. Demand for vacation on the moon d. The impact of price increase of 10% would have on the sales of marmaladearrow_forward22. Handy, Inc., produces a solar-powered electronic calculator that has experienced the following monthly sales history for the first four months of the year, in thousands of units: 23.3 March January February 30.3 72.3 April 15.5 a. If the forecast for January was 25, determine the one-step-ahead forecasts for February through May using exponential smoothing with a smoothing con- stant of a = .15. b. Repeat the calculation in part (a) for a value of a forecasts do you observe? c. Compute the MSES for the forecasts you obtained in parts (a) and (b) for February through April. Which value of a gave more accurate forecasts, based on the MSE? .40. What difference in thearrow_forwardJanuary February March April May June a. Calculate forecasts for the remaining five months using simple exponential smoothing with a = 0.4. February March April May June ACTUAL FORECAST 100 85 96 103 82 66 90 MAD Forecasts 91 93 97 91 81 b. Calculate the MAD for all the forecasts, including January's. (Round your answer to 1 decimal place.)arrow_forward
 Practical Management ScienceOperations ManagementISBN:9781337406659Author:WINSTON, Wayne L.Publisher:Cengage,
 Contemporary MarketingMarketingISBN:9780357033777Author:Louis E. Boone, David L. KurtzPublisher:Cengage Learning
 MarketingMarketingISBN:9780357033791Author:Pride, William MPublisher:South Western Educational Publishing