
Concept explainers
Videos
Two independent methods of
a. Compute the MSE and MAD for each forecast. Does either forecast seem superior? Explain.
b. Compute MAPE for each forecast.
c. Prepare a naive forecast for periods 2 through 11 using the given sales data Compute each of the following: (1) MSE, (2) MAD, (3) tracking signal at month 10, and (4) 2s control limits How do the naive results compare with the other two forecasts?
a)
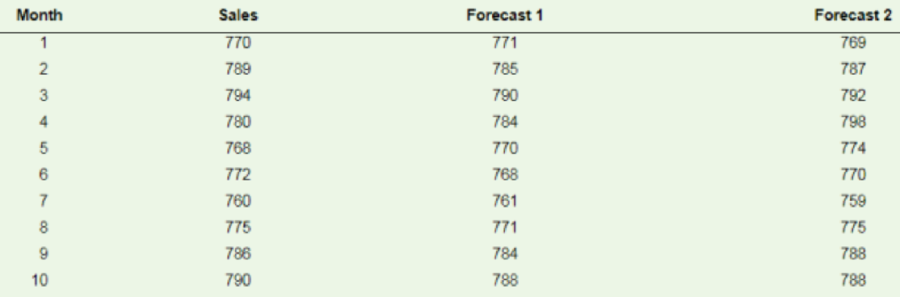
To compare: The MAD and MSE for two forecasts given below, including actual sales for 10 months.
Introduction: Mean Absolute Deviation (MAD) is the average distance between the data values and the mean. Mean Squared Error (MSE) is the average of the squares of the deviation and error.
Explanation of Solution
Given information:
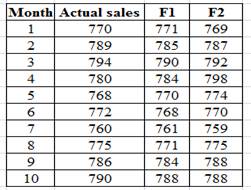
Compute the MAD and MSE as shown below in the table:
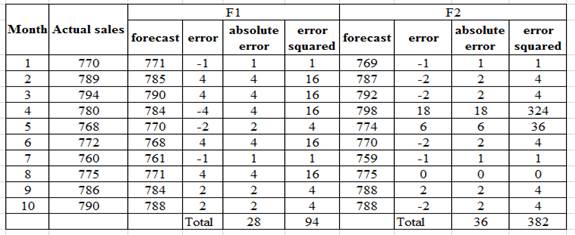
Compute the Mean absolute deviation (MAD) for the forecasting method F1 as shown below
Substitute the value of
Compute the Mean squared error (MSE) for the forecasting method F1 as shown below
Substitute the value of
Compute the Mean absolute deviation (MAD) for the forecasting method F2 as shown below
Substitute the value of
Compute the Mean squared error (MSE) for the forecasting method F2 as shown below
Substitute the value of
The first forecasting method F1 gives both a low value of MAD as well as MSE compared to the second forecasting method F2
b)
To compute: Mean Absolute Percentage Error for both the forecasts F1 and F2 as shown below.
Introduction: Forecasting is the planning process that helps to predict the future demand using present or past data. It uses certain assumptions based the knowledge and experience of the management.
Explanation of Solution
Determine MAPE for both the forecasts:
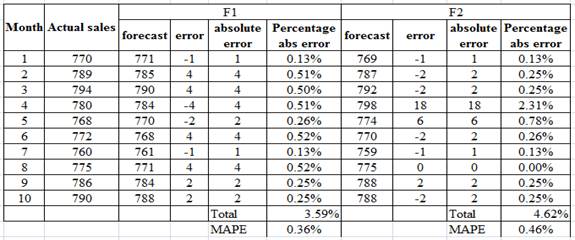
The Mean absolute percentage error is lower at 0.36% for the first forecasting method F1 compared to MAPE of 0.46% for the second forecasting method F2
c)
To prepare: A naïve forecast.
Introduction: Forecasting is the planning process that helps to predict the future demand using present or past data. It uses certain assumptions based the knowledge and experience of the management.
Explanation of Solution
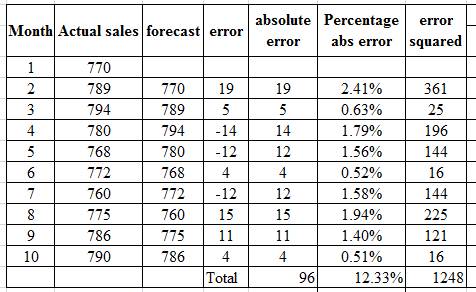
Determine MAD and MSE using a naïve forecast:
Use the naïve method for forecasting as shown below.
(i)
Compute the Mean absolute deviation (MAD) for the naïve forecasting method as shown below
Substitute the value of
(ii)
Compute the Mean squared error (MSE) for the naïve forecasting method as shown below
Substitute the value of
(iii)
Compute the tracking signal on the 10th month as shown below.
First compute the cumulative forecast error (CFE) as shown below
12.49=
Compute the tracking signal (TS) by dividing the cumulative forecast error by MAD as shown below.
(iv)
Given the Mean Squared Error is 156, the standard deviation σ is 12.49
The two sigma control limits are +2×12.49=24.98 and -2×12.49=–24.98
Since the tracking signal 1.87 falls between +24.98 and –24.98, the forecasting process is in control
The comparison of the naïve method with the other two forecasting methods is shown below.
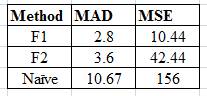
Obviously the naïve method compares very poorly with the other two methods F1 and F2, since both the Mean Absolute Deviation (MAD) and Mean Squared Error (MSE) are worse than the other two methods.
Want to see more full solutions like this?
Chapter 3 Solutions
Operations Management


 Practical Management ScienceOperations ManagementISBN:9781337406659Author:WINSTON, Wayne L.Publisher:Cengage,
 Operations ManagementOperations ManagementISBN:9781259667473Author:William J StevensonPublisher:McGraw-Hill Education
 Operations and Supply Chain Management (Mcgraw-hi...Operations ManagementISBN:9781259666100Author:F. Robert Jacobs, Richard B ChasePublisher:McGraw-Hill Education
 Purchasing and Supply Chain ManagementOperations ManagementISBN:9781285869681Author:Robert M. Monczka, Robert B. Handfield, Larry C. Giunipero, James L. PattersonPublisher:Cengage Learning
 Production and Operations Analysis, Seventh Editi...Operations ManagementISBN:9781478623069Author:Steven Nahmias, Tava Lennon OlsenPublisher:Waveland Press, Inc.