Indifference curve and budget line in the work-leisure model.
Explanation of Solution
An indifference curve in work-leisure model represents the combination of real income and leisure time that provide the same level of satisfaction to the worker.
In work-leisure model, budget line represents all possible combinations of real income and leisure that the worker obtained from the given wage rate.
The indifference curve is downward sloping, which means that it is negatively sloped because the workers are willing to give up leisure time in order to get more income and maintain equal satisfaction. If the time spent on leisure is reduced, income will increase. Thus, the indifference curve will be downward sloping.
Another major feature is that indifference curve is convex to the origin. The convexity implies that the marginal rate of substitution between income and leisure time decreases as a worker moves along the indifference curve, where the marginal rate of substitution indicates that one is given up for another. Thus, the indifference curve is convex to the origin.
The graphical representation of indifference curve and budget line is represented as follows:
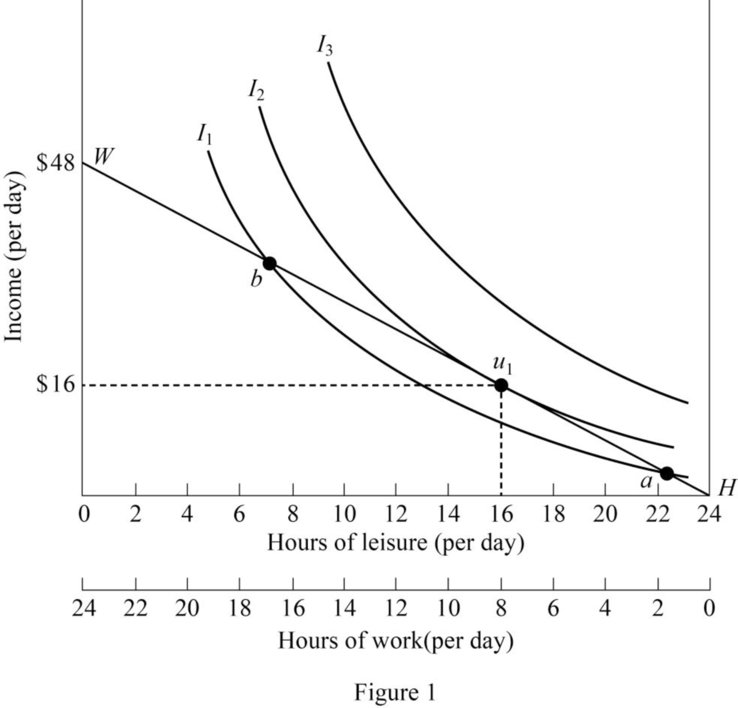
In the figure, the horizontal axis represents hours of leisure and work and the vertical axis represents income. The downward sloping curve is the budget line of the worker. IC1, IC2, and IC3 are the indifference curves. The tangent point of budget constraints and indifference curve indicates the optimal choice. Thus, in the figure, U1 is the optimal point, where the worker will work for 8 hours per day and 16 hours spend for leisure in order to get $16 each day.
Want to see more full solutions like this?
Chapter 2 Solutions
Contemporary Labor Economics

- A worker , who satisfies our normal assumptions , is indifferent between consuming 4 units of leisure while earning 100 dollars and consuming 12 units of leisure while earning 40 dollars . If both bundles are feasible , is this worker maximizing utility ? Why or why not ?arrow_forwardIf the consumer's non-labor income increases while wages remain unchanged, what will happen to the budget line? A) The budget line shifts inward without a change in slope. B) The budget line rotates inward from the intercept on the horizontal axis. C) The budget line rotates outward from the intercept on the vertical axis. D) The budget line shifts outward without a change in slope. An optimum labor-leisure that occurs as a corner solution A) can be an equilibrium in the aggregate economy. B) includes the consumption of only one good. C) cannot exhaust the budget constraint. D) includes the exact same amounts of each good. ) If a firm is a price taker in both the labor market and the output market, it will A) hire labor until the marginal product of labor equals the output price. B) hire labor until the marginal product of labor equals zero. C) earn zero economic profit in the short run. D) hire labor until the marginal product of labor equals the wage rate.arrow_forwardFill in the blanks and round to 2 decimals where needed. Katie has 75 hours per week to allocate to leisure or work. She has a job that pays $30 per hour, she has $150 nonlabour income per week and the price of the (composite) consumption good is p=$1. Her preferences are given by U(C,L) = ½ C L. Katie's reservation wage is $ 30 and she prefers to work 87.5 hours per week. If Katie's nonlabour income rises to $210, she would prefer to work 68 hours per week. If Katie's hourly wage was to rise to $40, she would prefer to work 72 hours per week (with the original Yn=150). Considering the change in hours in response to the wage rise, the effect clearly dominates the effect.arrow_forward
- An individual values both consumption and leisure. Suppose the individual has 1600 hours per week they can allocate between leisure and work. IF the individual works, they make a wage of $25 per hour. The individual's utility function is given as a function of leisure time, L and consumption, c: U(L, c) = L^(1/2)c ^ (1/2) a) Draw the individual's budget constraint for leisure and consumption. b) How much leisure time will the individual have when utility maximizing? c) Consider a Universal Basic Income policy like the one proposed by Andrew Yang that would give all individuals a lump -sum, unconditional cash transfer of $1,000 each month. How much leisure time will the individual have when utility maximizing with the cash transfer? d) Now suppose, instead of a cash transfer, a minimum wage of $40 per hour is implemented. How much leisure time will the individual have when utility maximizing with the cash transfer? e) What change in leisure time can be attributed to the substitution…arrow_forwardOn average, people sleep 8 hours per day meaning that each individual has 16 hours per day to allocate between labour and leisure. Assuming that the wage rate is $15 per hour and there are non-labor income is zero. The utility function of an individual is given by U(Y, L) = YL and for simplicity, the price index for real income is 1. a. Determine the budget constraint. b. Determine the marginal rate of substitution. c. What are the optimal labor and leisure hours? d. At the optimal relationship, what is the utility level for the individual?arrow_forwardConsider the standard labor-leisure choice model. Consumer gets utility from consumption (C) and leisure (L). She has H total hours. She works NS hours and receives the hourly wage, w. She has some non-labor income T and pays lump-sum tax T. Further suppose (n-T)>0. The shape of utility function is downward-sloping and bowed-in towards the origin (the standard U-shaped case just like a cobb-douglas function) If this consumer decides to NOT WORK AT ALL, then it must be the case that O A. MUL = MUC O B. MRSL,CI 2 w OC. IMRSL,CIs w O D. MRSL,C = w O E. None of abovearrow_forward
- Marley has 100 hours per week available she can spend either working or doing leisure activities. He can work at a wage rate of $50 per hour. Bob receives $1000 of rental income per week, no matter how much he works. Use leisure-income model to solve this:- i) draw Marley budget line and optimal choice of working 80 hours in a week then calculate the maximum and optimal amount of income ii.) And suppose Marley is suppose to share the household expenses and then be taxed 50% of her wage income. then draw another diagram to compare Marley choice in Part i) and the new labour supply decision of working 90 hours per week due to the tax. Clearly label out the income effect, substitution effect and total effect in the diagram.arrow_forwardConsider the following labor-leisure choice model. Utility function over consumption (C) and leisure (L) U(C.L) = (1/3L1/3 Total hours: H = 40 Labor hours: NS = H - L Non-labor income: π = 30 Lumpsum tax: T = 10 Hourly wage: w = 4 Suppose the hourly wage changes to w = 3. What is the substitution effect of this change on labor supply? A. +2.65 B. -2.65 C. +3.48 D.-3.48 E. None of the abovearrow_forwardWhat factors influence an individual's decision to allocate time between work and leisure in the context of the work-leisure model?arrow_forward
- Assume Lorena derives utility from consumption and leisure. Through the following utility function. U=VC-R where C is consumption and R is hours of leisure consumed per day (there are 24 hours in her day). Let w be the wage rate and H be the hours of work chosen. The price of consumption goods, C, is $1. In addition, assume Lorena has $M amount of non- wage income each day. Set up the utility maximizing Lagrangian needed to maximize utility subject to the budget constraint but do not solve for the demand for C and R. a b. Draw the consumer choice model for this situation (fully label the graph). Use it to graphically derive/describe/explain her labor supply function and explain what would be true for her labor supply to rise or fall when the wage rises (you may want to draw the graph twice. Measure and explain the loss in consumer surplus using the concept of compensating variation. g. h. What is the expenditure-price elasticity equation for y? That is, the elasticity for the % change…arrow_forwardConsider a worker who consumes one good and has a preference for leisure. She maximizes the utility function u(x, L) = xL, where a represents consumption of the good and L represents leisure. Suppose that this worker can choose any L = [0, 1], and receives income w(1 L); w represents the wage rate. Let p denote the price of the consumption good. In addition to her wage income, the worker also has a fixed income of y ≥ 0. (a) Write down the utility maximization problem for this consumer. (b) Find the Marshallian demands for the consumption good and leisure. (c) Find the indirect utility as a function of p, w, and y.arrow_forwardA worker earns £15 pounds an hour and chooses to work six hours a day. The worker has noother source of income. For the question below, assume that the worker has “standard” Cobb-Douglas preferences. When considering wage changes, assume that the “income effect”outweighs the “substitution effect”. (a) Write down the worker’s budget constraint and then represent the worker’schoice in a suitably labelled graph. (b) The government gives the worker £80, but taxes the worker’s wage, such thattheir take-home wage is £10. Model this policy in a suitably labelled graph. Isthe worker better off (in terms of utility) after this policy? Note –there are arange of correct answers for the worker’s new hours/income. Choose one thatis consistent with the information given in the question.arrow_forward

 Principles of Economics (12th Edition)EconomicsISBN:9780134078779Author:Karl E. Case, Ray C. Fair, Sharon E. OsterPublisher:PEARSON
 Engineering Economy (17th Edition)EconomicsISBN:9780134870069Author:William G. Sullivan, Elin M. Wicks, C. Patrick KoellingPublisher:PEARSON
 Principles of Economics (MindTap Course List)EconomicsISBN:9781305585126Author:N. Gregory MankiwPublisher:Cengage Learning
 Managerial Economics: A Problem Solving ApproachEconomicsISBN:9781337106665Author:Luke M. Froeb, Brian T. McCann, Michael R. Ward, Mike ShorPublisher:Cengage Learning
 Managerial Economics & Business Strategy (Mcgraw-...EconomicsISBN:9781259290619Author:Michael Baye, Jeff PrincePublisher:McGraw-Hill Education