
Concept explainers
The price at which the amount demanded equals 15 billion bushels per year and shows the
Explanation of Solution
The demand function for corn is given below:
Substitute the respective values in Equation (1) to calculate Y axis value or the price of corn.
The price of corn is $9.5.
The X axis value or quantity demanded for corn is calculated as follows using Equation (1):
The quantity demanded for corn is 19 units.
To calculate the price at which the amount demanded equals 15 billion bushels per year, substitute the quantity demanded as 15 in Equation (1).
The price of corn when the demand is equal to 15 billion bushels is $2.
The demand curve for corn is shown below:
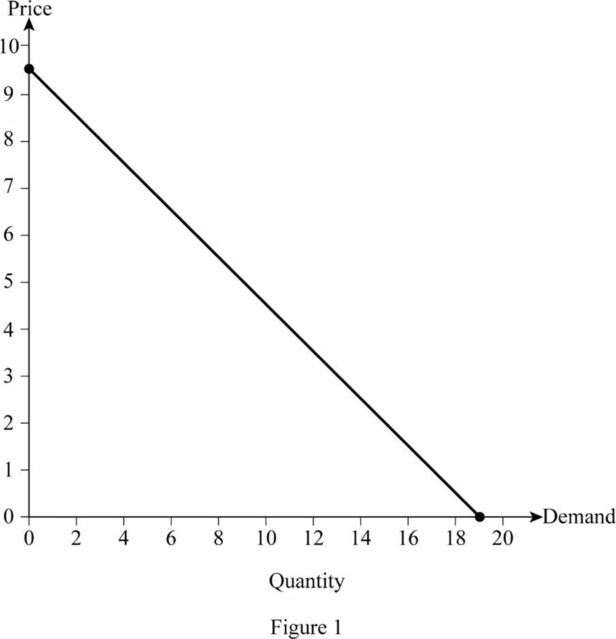
In Figure 1, the vertical axis measures the price of corn and horizontal axis measures the quantity demanded. The downward sloping curve is the demand curve for corn. From this figure, it is clear that the price of corn for 19 units of corn is $9.6.
Demand: Demand refers to the total value of goods and services that are demanded at a particular price in a given period of time.
Demand curve: The demand curve shows the quantity demanded at different price levels. There is a negative relationship between the price and quantity demanded and the demand curve slopes downward.
Want to see more full solutions like this?
Chapter 2 Solutions
Microeconomics


- Suppose that the quantity of corn supplied depends on the price of corn (P) and the amount of rainfall (R). The demand for corn depends on the price of corn and the level of disposable income (I). The equations describing the supply and demand relationships are Qs = 20R + 100P and Qd = 4000 − 100P + 10I. a) Sketch a graph of demand and supply curves b) Sketch a graph that shows the effect of an increase in rainfall on the equilibrium price and quantity of corn. c) Sketch a graph of demand and supply curves that shows the effect of a decrease in disposable income on the equilibrium price and quantity of corn.arrow_forwardUsing the supply and demand functions below, derive the demand and supply curves if Y = $55,000 and p. =$14. What is the equilibrium price and quantity of coffee? The demand function for coffee is Q = 8.5 -p+0.01Y, where Q is the quantity of coffee in millions of pounds per year, p is the price of coffee in dollars per pound, and Y is the average annual household income in high-income countries in thousands of dollars. The coffee supply function is Q = 9.6 + 0.5p – 0.2pc. where p, is the price of cocoa in dollars per pound. The equilibrium price of coffee is p=$ per pound and the equilibrium quantity is Q = millions of pounds per year. (Enter your responses rounded to two decimal places.)arrow_forwardBetween 1950 and 2020, the price of wheat fell dramatically from $20.23 per bushel to $4.85 per bushel. Suppose between 1950 and 2020, the supply of wheat increased substantially due to increases in productivity, shifting the wheat supply curve to the right. With this supply shift, the amount by which the price of wheat falls will be larger the more the demand for wheat. In addition, assume that between 1950 and 2020 the income of the average American increased substantially and that wheat is a normal good. With this increase in income, OA. the price of wheat will be unaffected. OB. the amount by which the price of wheat rises will be smaller the higher the income elasticity of wheat. C. the amount by which the price of wheat falls will be smaller the higher the income elasticity of wheat. OD. the amount by which the price of wheat rises will be smaller the lower the income elasticity of wheat. OE. the amount by which the price of wheat falls will be larger the higher the income…arrow_forward
- Consider the market for pens. Suppose that the number of students with an allergy to pencil erasers increases, causing more students to switch from pencils to pens in school. Moreover, the price of ink, an important input in pen production, has dropped considerably. On the following graph, labeled Scenario 1, indicate the effect these two events have on the demand for and supply of pens. Note: Select and drag one or both of the curves to the desired position. Curves will snap into position, so if you try to move a curve and it snaps back to its original position, just drag it a little farther. 10 1 0 2 Scenario 1 Equilibrium Object Price Quantity Supply True False Demand QUANTITY (Mons of pens) Next, complete the following graph, labeled Scenario 2, by shifting the supply and demand curves In the same way that you did on the Scenario 1 graph. Scenario 2 Supply Demand QUANTITY() '0 Demand 9 10 Scenario 1 Supply Demand (?) Supply Compare both the Scenario 1 and Scenario 2 graphs. Notice…arrow_forwardWe obtain the following demand curve of beef in a market: = 30302.189-4303.602 In (P), where Q is quantity demanded of beef measured in pounds, P is price measured in dollars per pound. We know P = 8.906 and Q=12027.759. Based on this information, if price increases by 1 dollar, quantity demanded decreases by _%. (Only type in the number in your answer, do not type in the percentage sign "%" again.)arrow_forwardConsider the demand function for processed pork in Canada, Q = 171 - 20p + 20p, + 3p, + 0.002Y where Q is the quantity of pork demanded (measured in millions of kg per year), p is the price of pork, Ph is the price of beef, Pc is the price of chicken, and Y is the income of consumers. If per capita income, Y, increases by $180 a year, then the quantity demanded changes by million kg. per year. (Enter a numeric response using a real number rounded to two decimal places.) 30 tv MacBook Air 80 DII DD esc F1 F2 F3 F4 F6 F7 F8 F9 F10 FY @ $ & 1 4 7 8 9 %3D Q W E R Y tab A D F H J K L * 3arrow_forward
- A certain manufacturer has determined that the weekly demand and supply functions for their product are given by the equations: supply: p=-2x² +80 demand: p = 15x+30 where z represents the quantity demanded in units of a thousand and p is the unit price in dollars. Find the market equilibrium (equilibrium price and equilibrium quantity).arrow_forwardSuppose the technology to manufacture computers improves but due to some recession in the economy, the income of the consumers falls. Assuming computers to be a normal good, what will be the equilibrium quantity and price for computers in this case?"arrow_forwardUsing the supply and demand functions below, derive the demand and supply curves if Y=$55,000 and pc=$13. What is the equilibrium price and quantity of coffee? Part 2 The demand function for coffee is Q=8.5−p+0.01Y, where Q is the quantity of coffee in millions of pounds per year, p is the price of coffee in dollars per pound, and Y is the average annual household income in high-income countries in thousands of dollars. The coffee supply function is Q=9.6+0.5p−0.2pc, where pc is the price of cocoa in dollars per pound. Part 3 The equilibrium price of coffee is p=$enter your response here per pound and the equilibrium quantity is Q=enter your response here millions of pounds per year. (Enter your responses rounded to two decimal places.)arrow_forward
- Suppose that the market for video games is competitive with demand function where is the quantity demanded, is the market price, is the monthly budget that an average consumer has available for entertainment, is the average price of a movie, and is the price of a controller that is required to play these games. Given that use excel to calculate quantity demanded for to in $5 increments. Use the excel’s charting tool to draw the demand curve.arrow_forwardUsing the supply and demand functions below, derive the demand and supply curves if Y=$55,000 and pc=$9. What is the equilibrium price and quantity of coffee? Part 2 The demand function for coffee is Q=8.5−p+0.01Y, where Q is the quantity of coffee in millions of pounds per year, p is the price of coffee in dollars per pound, and Y is the average annual household income in high-income countries in thousands of dollars. The coffee supply function is Q=9.6+0.5p−0.2pc, where pc is the price of cocoa in dollars per pound.arrow_forwardThe demand for coffee is given by the following equation, where QD�� stands for the quantity demanded and P stands for price. QD=100−4PQD= 100- 4P The supply of coffee is given by the following equation, where QS�� stands for the quantity supplied and P stands for price. QS=-10+2PQS= -10+ 2P For parts a-d, consider a graph of the demand and supply curves with price on the vertical axis and quantity on the horizontal axis. What is the slope of demand? Slope = At what price is quantity demanded equal to zero (this is, graphically, the vertical intercept of Demand)? P = What is the slope of supply? Slope = At what price is quantity supplied equal to zero (this is, graphically, the vertical intercept of Supply)? P =arrow_forward

 Principles of Economics (12th Edition)EconomicsISBN:9780134078779Author:Karl E. Case, Ray C. Fair, Sharon E. OsterPublisher:PEARSON
 Engineering Economy (17th Edition)EconomicsISBN:9780134870069Author:William G. Sullivan, Elin M. Wicks, C. Patrick KoellingPublisher:PEARSON
 Principles of Economics (MindTap Course List)EconomicsISBN:9781305585126Author:N. Gregory MankiwPublisher:Cengage Learning
 Managerial Economics: A Problem Solving ApproachEconomicsISBN:9781337106665Author:Luke M. Froeb, Brian T. McCann, Michael R. Ward, Mike ShorPublisher:Cengage Learning
 Managerial Economics & Business Strategy (Mcgraw-...EconomicsISBN:9781259290619Author:Michael Baye, Jeff PrincePublisher:McGraw-Hill Education