
Videos
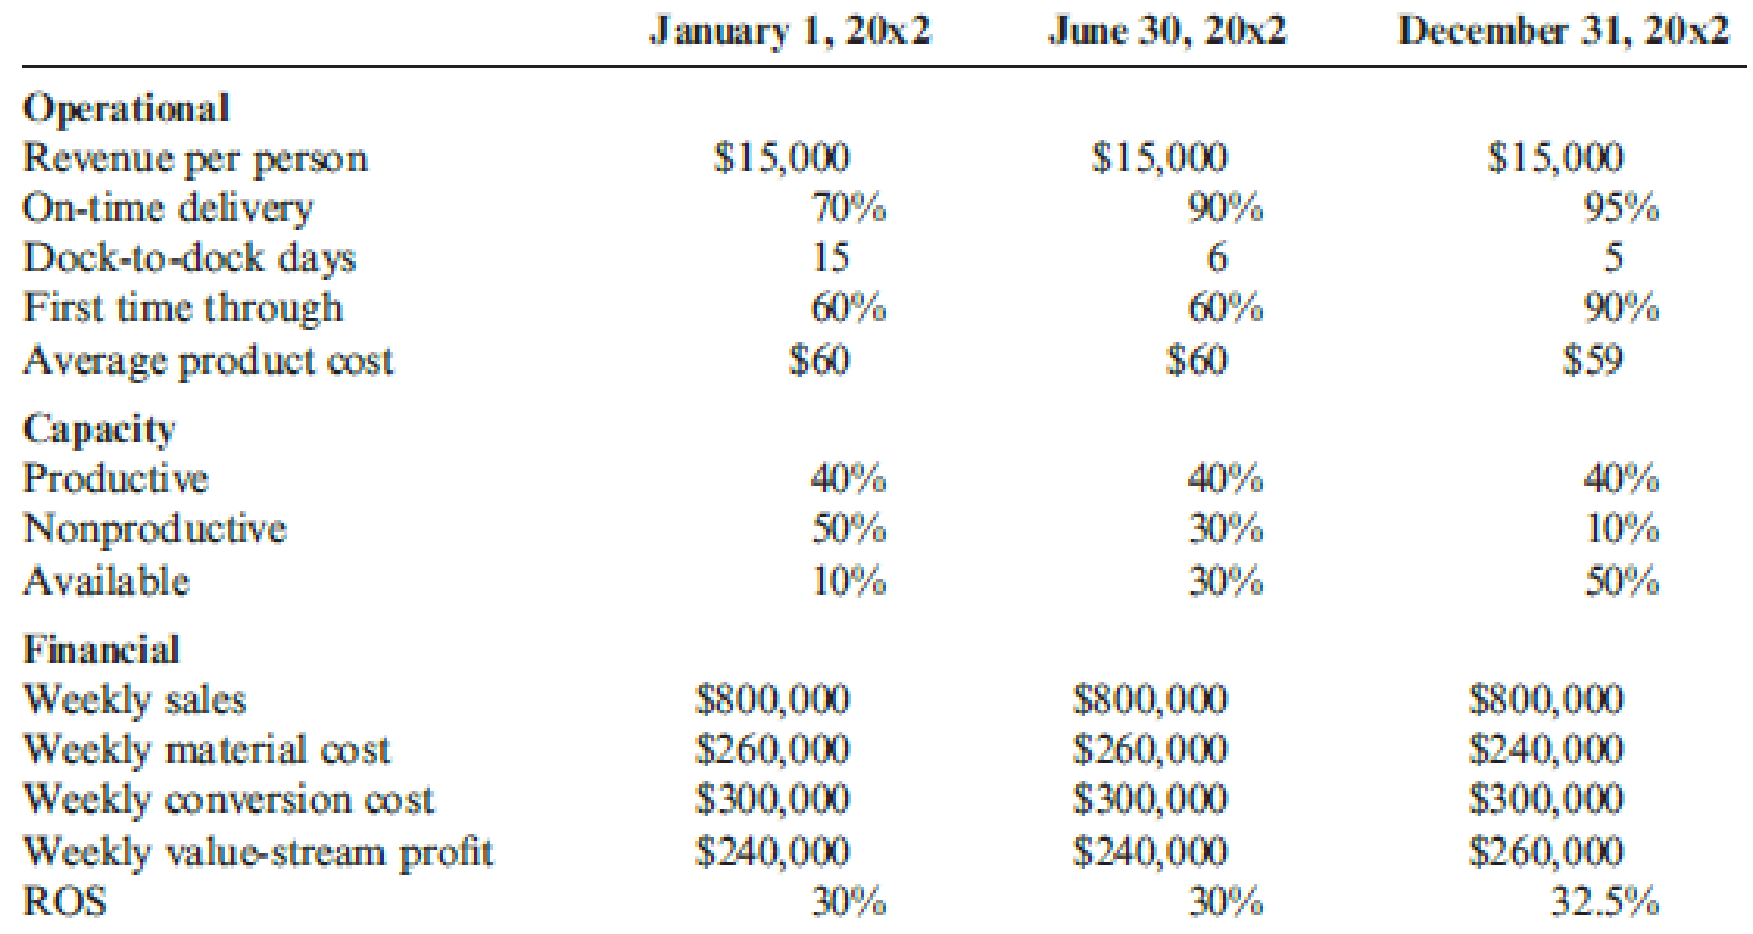
Bradford Company, a manufacturer of small tools, implemented lean manufacturing at the end of 20x1. The company’s goal for the year was to increase the ROS to 40 percent of sales. A value-stream team was established and began to work on lean improvements. During the year, the team was able to achieve significant results on several fronts. The Box Scorecard below reflects the performance measures at the beginning of the year, midyear, and end of year. Although the team members were pleased with their progress, they were disappointed in the financial results. They were still far from the targeted ROS of 40 percent. They were also puzzled as to why the improvements made did not translate into significantly improved financial performance.
Required:
- 1. From the scorecard, what was the focus of the value-stream team for the first six months? The second six months? What are the implications of these changes?
- 2. Using information from the scorecard, offer an explanation for why the financial results were not as good as expected.
- 3. Suppose that on December 31, 20x2, a potential customer offered to purchase an order of goods that would increase weekly revenues in January by $100,000 and material cost by $30,000. Using the old
standard cost system, the projected conversion cost of the order would be $60,000. Would you recommend that the order be accepted or rejected? Explain.

Trending nowThis is a popular solution!

Chapter 15 Solutions
Cornerstones of Cost Management (Cornerstones Series)


- Merkley Company, a manufacturer of machine parts, implemented lean manufacturing at the end of 20X1. Three value streams were established: one for new product development and two order fulfillment value streams. One of the value streams set a goal to increase its ROS to 45% of sales by the end of the year. During the year, the value stream made significant improvements in several areas. The Box Scorecard below was prepared, with performance measures for the beginning of the year, midyear, and end of year. Although the members of the value stream were pleased with their progress, they were disappointed in the financial results. They were still far from the targeted ROS of 45%. They were also puzzled as to why the improvements made did not translate into significantly improved financial performance. Required: 1. From the scorecard, what was the focus of the value-stream team for the first 6 months? The second 6 months? What are the implications of these changes? 2. Using information from the scorecard, offer an explanation for why the financial results were not as good as expected.arrow_forwardAt the end of 20x1, Mejorar Company implemented a low-cost strategy to improve its competitive position. Its objective was to become the low-cost producer in its industry. A Balanced Scorecard was developed to guide the company toward this objective. To lower costs, Mejorar undertook a number of improvement activities such as JIT production, total quality management, and activity-based management. Now, after two years of operation, the president of Mejorar wants some assessment of the achievements. To help provide this assessment, the following information on one product has been gathered: Required: 1. Compute the following measures for 20x1 and 20x3: a. Actual velocity and cycle time b. Percentage of total revenue from new customers (assume one unit per customer) c. Percentage of very satisfied customers (assume each customer purchases one unit) d. Market share e. Percentage change in actual product cost (for 20x3 only) f. Percentage change in days of inventory (for 20x3 only) g. Defective units as a percentage of total units produced h. Total hours of training i. Suggestions per production worker j. Total revenue k. Number of new customers 2. For the measures listed in Requirement 1, list likely strategic objectives, classified according to the four Balance Scorecard perspectives. Assume there is one measure per objective.arrow_forwardThe controller of Emery, Inc. has computed quality costs as a percentage of sales for the past 5 years (20X1 was the first year the company implemented a quality improvement program). This information is as follows: Required: 1. Prepare a trend graph for total quality costs. Comment on what the graph has to say about the success of the quality improvement program. 2. Prepare a graph that shows the trend for each quality cost category. What does the graph have to say about the success of the quality improvement program? Does this graph supply more insight than the total cost trend graph does? 3. Prepare a graph that compares the trend in relative control costs versus relative failure costs. Comment on the significance of this trend.arrow_forward
- In 20x5, Major Company initiated a full-scale, quality improvement program. At the end of the year, Jack Aldredge, the president, noted with some satisfaction that the defects per unit of product had dropped significantly compared to the prior year. He was also pleased that relationships with suppliers had improved and defective materials had declined. The new quality training program was also well accepted by employees. Of most interest to the president, however, was the impact of the quality improvements on profitability. To help assess the dollar impact of the quality improvements, the actual sales and the actual quality costs for 20x4 and 20x5 are as follows by quality category: All prevention costs are fixed (by discretion). Assume all other quality costs are unit-level variable. Required: 1. Compute the relative distribution of quality costs for each year and prepare a pie chart. Do you believe that the company is moving in the right direction in terms of the balance among the quality cost categories? Explain. 2. Prepare a one-year trend performance report for 20x5 (compare the actual costs of 20x5 with those of 20x4, adjusted for differences in sales volume). How much have profits increased because of the quality improvements made by Major Company? 3. Estimate the additional improvement in profits if Major Company ultimately reduces its quality costs to 2.5 percent of sales revenues (assume sales of 10 million).arrow_forwardGagnon Company reported the following sales and quality costs for the past four years. Assume that all quality costs are variable and that all changes in the quality cost ratios are due to a quality improvement program. Required: 1. Compute the quality costs for all four years. By how much did net income increase from Year 1 to Year 2 because of quality improvements? From Year 2 to Year 3? From Year 3 to Year 4? 2. The management of Gagnon Company believes it is possible to reduce quality costs to 2.5 percent of sales. Assuming sales will continue at the Year 4 level, calculate the additional profit potential facing Gagnon. Is the expectation of improving quality and reducing costs to 2.5 percent of sales realistic? Explain. 3. Assume that Gagnon produces one type of product, which is sold on a bid basis. In Years 1 and 2, the average bid was 400. In Year 1, total variable costs were 250 per unit. In Year 3, competition forced the bid to drop to 380. Compute the total contribution margin in Year 3 assuming the same quality costs as in Year 1. Now, compute the total contribution margin in Year 3 using the actual quality costs for Year 3. What is the increase in profitability resulting from the quality improvements made from Year 1 to Year 3?arrow_forwardLindell Manufacturing embarked on an ambitious quality program that is centered on continual improvement. This improvement is operationalized by declining quality costs from year to year. Lindell rewards plant managers, production supervisors, and workers with bonuses ranging from 1,000 to 10,000 if their factory meets its annual quality cost goals. Len Smith, manager of Lindells Boise plant, felt obligated to do everything he could to provide this increase to his employees. Accordingly, he has decided to take the following actions during the last quarter of the year to meet the plants budgeted quality cost targets: a. Decrease inspections of the process and final product by 50% and transfer inspectors temporarily to quality training programs. Len believes this move will increase the inspectors awareness of the importance of quality; also, decreasing inspection will produce significantly less downtime and less rework. By increasing the output and decreasing the costs of internal failure, the plant can meet the budgeted reductions for internal failure costs. Also, by showing an increase in the costs of quality training, the budgeted level for prevention costs can be met. b. Delay replacing and repairing defective products until the beginning of the following year. While this may increase customer dissatisfaction somewhat, Len believes that most customers expect some inconvenience. Besides, the policy of promptly dealing with customers who are dissatisfied could be reinstated in 3 months. In the meantime, the action would significantly reduce the costs of external failure, allowing the plant to meet its budgeted target. c. Cancel scheduled worker visits to customers plants. This program, which has been very well received by customers, enables Lindell workers to see just how the machinery they make is used by the customer and also gives them first-hand information on any remaining problems with the machinery. Workers who went on previous customer site visits came back enthusiastic and committed to Lindells quality program. Lindells quality program staff believes that these visits will reduce defects during the following year. Required: 1. Evaluate Lens ethical behavior. In this evaluation, consider his concern for his employees. Was he justified in taking the actions described? If not, what should he have done? 2. Assume that the company views Lens behavior as undesirable. What can the company do to discourage it? 3. Assume that Len is a CMA and a member of the IMA. Refer to the ethical code for management accountants in Chapter 1. Were any of these ethical standards violated?arrow_forward
- Recently, Ulrich Company received a report from an external consulting group on its quality costs. The consultants reported that the companys quality costs total about 21 percent of its sales revenues. Somewhat shocked by the magnitude of the costs, Rob Rustin, president of Ulrich Company, decided to launch a major quality improvement program. For the coming year, management decided to reduce quality costs to 17 percent of sales revenues. Although the amount of reduction was ambitious, most company officials believed that the goal could be realized. To improve the monitoring of the quality improvement program, Rob directed Pamela Golding, the controller, to prepare monthly performance reports comparing budgeted and actual quality costs. Budgeted costs and sales for the first two months of the year are as follows: The following actual sales and actual quality costs were reported for January: Required: 1. Reorganize the monthly budgets so that quality costs are grouped in one of four categories: appraisal, prevention, internal failure, or external failure. (Essentially, prepare a budgeted cost of quality report.) Also, identify each cost as variable (V) or fixed (F). (Assume that no costs are mixed.) 2. Prepare a performance report for January that compares actual costs with budgeted costs. Comment on the companys progress in improving quality and reducing its quality costs.arrow_forwardThe president of a small manufacturing firm is concerned about the continual increase in manufacturing costs over the past several years. The following figures provide a time series of the cost per unit for the firms leading product over the past eight years: a. Construct a time series plot. What type of pattern exists in the data? b. Use simple linear regression analysis to find the parameters for the line that minimizes MSE for this time series. c. What is the average cost increase that the firm has been realizing per year? d. Compute an estimate of the cost/unit for next year.arrow_forwardJavier Company has sales of 8 million and quality costs of 1,600,000. The company is embarking on a major quality improvement program. During the next three years, Javier intends to attack failure costs by increasing its appraisal and prevention costs. The right prevention activities will be selected, and appraisal costs will be reduced according to the results achieved. For the coming year, management is considering six specific activities: quality training, process control, product inspection, supplier evaluation, prototype testing, and redesign of two major products. To encourage managers to focus on reducing non-value-added quality costs and select the right activities, a bonus pool is established relating to reduction of quality costs. The bonus pool is equal to 10 percent of the total reduction in quality costs. Current quality costs and the costs of these six activities are given in the following table. Each activity is added sequentially so that its effect on the cost categories can be assessed. For example, after quality training is added, the control costs increase to 320,000, and the failure costs drop to 1,040,000. Even though the activities are presented sequentially, they are totally independent of each other. Thus, only beneficial activities need be selected. Required: 1. Identify the control activities that should be implemented, and calculate the total quality costs associated with this selection. Assume that an activity is selected only if it increases the bonus pool. 2. Given the activities selected in Requirement 1, calculate the following: a. The reduction in total quality costs b. The percentage distribution for control and failure costs c. The amount for this years bonus pool 3. Suppose that a quality engineer complained about the gainsharing incentive system. Basically, he argued that the bonus should be based only on reductions of failure and appraisal costs. In this way, investment in prevention activities would be encouraged, and eventually, failure and appraisal costs would be eliminated. After eliminating the non-value-added costs, focus could then be placed on the level of prevention costs. If this approach were adopted, what activities would be selected? Do you agree or disagree with this approach? Explain.arrow_forward
- Pintura Company implemented a quality improvement program and tracked the following for the five years: By cost category as a percentage of sales for the same period of time: Required: 1. Prepare a bar graph that reveals the trend in quality cost as a percentage of sales (time on the horizontal axis and percentages on the vertical). Comment on the message of the graph. 2. Prepare a bar graph for each cost category as a percentage of sales. What does this graph tell you?arrow_forwardRoss Company implemented a quality improvement program and tracked the following for the five years: By cost category as a percentage of sales for the same period of time: Required: 1. Prepare a bar graph that reveals the trend in quality cost as a percentage of sales (time on the horizontal axis and percentages on the vertical). Comment on the message of the graph. 2. Prepare a bar graph for each cost category as a percentage of sales. What does this graph tell you? 3. What if management would like to have the trend in relative distribution of quality costs? Express this as a bar graph and comment on its significance.arrow_forwardDataSpan, Inc., automated its plant at the start of the current year and installed a flexible manufacturing system. The company is also evaluating its suppliers and moving toward Lean Production. Many adjustment problems have been encountered, including problems relating to performance measurement. After much study, the company has decided to use the performance measures below, and it has gathered data relating to these measures for the first four months of operations. Month 1 2 3 4 Throughput time (days) ? ? ? ? Delivery cycle time (days) ? ? ? ? Manufacturing cycle efficiency (MCE) ? ? ? ? Percentage of on-time deliveries 78 % 73 % 70 % 67 % Total sales (units) 2330 2230 2116 2036 Management has asked for your help in computing throughput time, delivery cycle time, and MCE. The following average times have been logged over the last four months: Average per Month (in days) 1 2 3 4 Move time per unit 0.8…arrow_forward
 Cornerstones of Cost Management (Cornerstones Ser...AccountingISBN:9781305970663Author:Don R. Hansen, Maryanne M. MowenPublisher:Cengage Learning
 Managerial Accounting: The Cornerstone of Busines...AccountingISBN:9781337115773Author:Maryanne M. Mowen, Don R. Hansen, Dan L. HeitgerPublisher:Cengage Learning
 Essentials of Business Analytics (MindTap Course ...StatisticsISBN:9781305627734Author:Jeffrey D. Camm, James J. Cochran, Michael J. Fry, Jeffrey W. Ohlmann, David R. AndersonPublisher:Cengage Learning