
Managerial Accounting: The Cornerstone of Business Decision-Making
7th Edition
ISBN: 9781337115773
Author: Maryanne M. Mowen, Don R. Hansen, Dan L. Heitger
Publisher: Cengage Learning
expand_more
expand_more
format_list_bulleted
Videos
Textbook Question
Chapter 13, Problem 30BEB
Pintura Company implemented a quality improvement program and tracked the following for the five years:
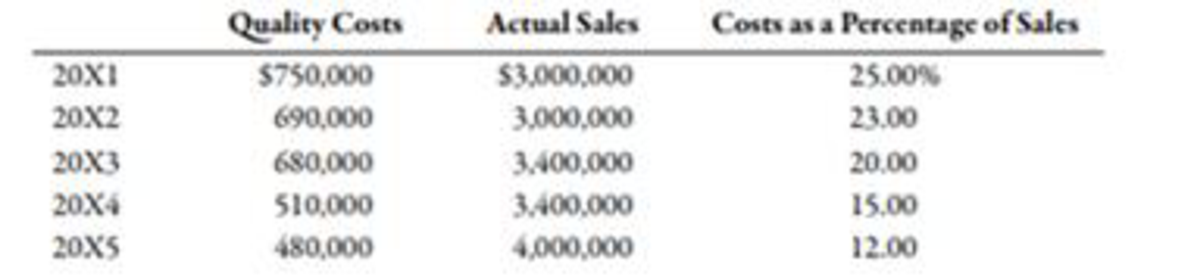
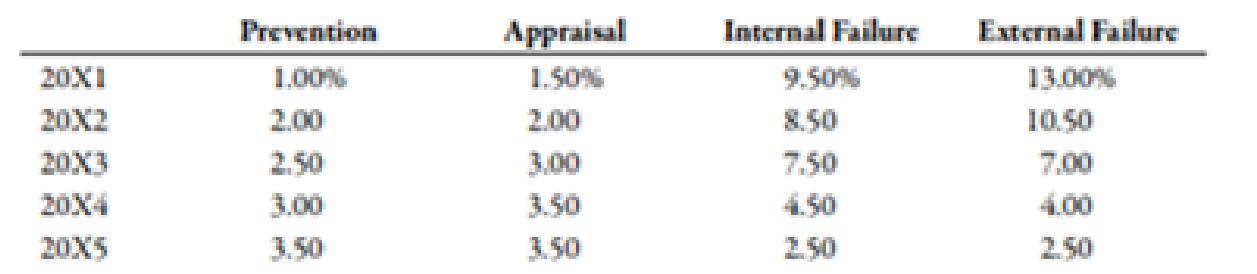
By cost category as a percentage of sales for the same period of time:
Required:
- 1. Prepare a bar graph that reveals the trend in quality cost as a percentage of sales (time on the horizontal axis and percentages on the vertical). Comment on the message of the graph.
- 2. Prepare a bar graph for each cost category as a percentage of sales. What does this graph tell you?
Expert Solution & Answer

Trending nowThis is a popular solution!

Students have asked these similar questions
Refer to the information for Jasper Company on the previous page.Required:1. Prepare an income statement for Jasper for last year. Calculate the percentage of sales for eachline item on the income statement. (Note: Round percentages to the nearest tenth of a percent.)2. CONCEPTUAL CONNECTION Briefly explain how a manager could use the incomestatement created for Requirement 1 to better control costs.
Required:1. Compute the ROI and the margin and turnover ratios for each year for the FurnitureDivision. (Round your answers to four significant digits.)2. Compute the ROI and the margin and turnover ratios for each year for the HousewareDivision. (Round your answers to four significant digits.)3. Explain the change in ROI from Year 1 to Year 2 for each division.
Below is a list of various metrics used to measure performance. For each metric, identify the correct balanced scorecard perspective with which the metric is associated.
Metric
Balanced Scorecard Perspective
Average stock price
Economic value added
Employee turnover rates
Manufacturing cycle time
Market share
Number of days from product launch to shelf
Number of defects
Number of new patent applications
Percentage of repeat customers
Percentage decrease in operating costs
Percentage of sales generated by new products
Research and development spending as a percentage of net revenues
options:
Customer
Financial
Internal Business
Learning and Growth
Chapter 13 Solutions
Managerial Accounting: The Cornerstone of Business Decision-Making
Ch. 13 - Prob. 1DQCh. 13 - Prob. 2DQCh. 13 - Why should the incremental cost of a risk response...Ch. 13 - Prob. 4DQCh. 13 - Explain how performance measurement can help...Ch. 13 - Identify and discuss the four kinds of quality...Ch. 13 - Discuss the benefits of quality cost reports that...Ch. 13 - Prob. 8DQCh. 13 - Prob. 9DQCh. 13 - When will the average unit cost be used for value...
Ch. 13 - How do international issues affect the role of the...Ch. 13 - What it a foreign trade zone, and what advantages...Ch. 13 - Prob. 13DQCh. 13 - Prob. 14DQCh. 13 - Prob. 15DQCh. 13 - A fire insurance policy on a manufacturing plant...Ch. 13 - Prob. 2MCQCh. 13 - Prob. 3MCQCh. 13 - Which of the following risk response items would...Ch. 13 - Beginning with strategy, which of the following...Ch. 13 - In which areas of an organizations value chain can...Ch. 13 - Prob. 7MCQCh. 13 - Which of the following items (correctly describes...Ch. 13 - Which of the following is a prevention cost? a....Ch. 13 - Prob. 10MCQCh. 13 - Prob. 11MCQCh. 13 - Prob. 12MCQCh. 13 - Prob. 13MCQCh. 13 - A manufacturing cell within a value stream has...Ch. 13 - Prob. 15MCQCh. 13 - Prob. 16MCQCh. 13 - Prob. 17MCQCh. 13 - Prob. 18MCQCh. 13 - Prob. 19MCQCh. 13 - Prob. 20BEACh. 13 - Quality Cost Report Whitley Company had total...Ch. 13 - Andresen Company had the following quality costs...Ch. 13 - Norris Company implemented a quality improvement...Ch. 13 - Mabbut Company has the following departmental...Ch. 13 - During the week of May 10, Hyrum Manufacturing...Ch. 13 - Prob. 26BEACh. 13 - Prob. 27BEBCh. 13 - Quality Cost Report Loring Company had total sales...Ch. 13 - Cassara, Inc., had the following quality costs for...Ch. 13 - Pintura Company implemented a quality improvement...Ch. 13 - Gumbrecht Company has the following departmental...Ch. 13 - During the week of August 21, Parley Manufacturing...Ch. 13 - Prob. 33BEBCh. 13 - Prob. 34ECh. 13 - Prob. 35ECh. 13 - Crazy Fan Guard Company provides security services...Ch. 13 - Jacks Apps Company researches, develops, and sells...Ch. 13 - Prob. 38ECh. 13 - Prob. 39ECh. 13 - Classify the following quality costs as prevention...Ch. 13 - Bradshaw Company reported sales of 5,000,000 in...Ch. 13 - The controller of Emery, Inc. has computed quality...Ch. 13 - Erba Inc. has the following departmental layout...Ch. 13 - A value stream has three activities and two...Ch. 13 - A Box Scorecard was prepared for a value stream:...Ch. 13 - Match each term in Column A with its related...Ch. 13 - Match each term in Column A with its related...Ch. 13 - Prob. 48ECh. 13 - Refer to Exercise 13-48. Suppose that Kamber is...Ch. 13 - Prob. 50ECh. 13 - Prob. 51PCh. 13 - Prob. 52PCh. 13 - Dorsey Scott MU Company manufactures and bottles a...Ch. 13 - Danna Wise, president of Tidwell Company, recently...Ch. 13 - Prob. 55PCh. 13 - In 20X1, Don Blackburn, president of Price...Ch. 13 - Brasher Company is transitioning to a lean...Ch. 13 - Merkley Company, a manufacturer of machine parts,...Ch. 13 - Paladin Company manufactures plain paper fax...Ch. 13 - Custom Shutters. Inc., manufactures plantation...Ch. 13 - Prob. 61PCh. 13 - Corporate sustainability reports vary greatly...Ch. 13 - Luna Company is a printing company and a...Ch. 13 - Lindell Manufacturing embarked on an ambitious...Ch. 13 - Paterson Company, a U.S.-based company,...
Knowledge Booster


Learn more about
Need a deep-dive on the concept behind this application? Look no further. Learn more about this topic, accounting and related others by exploring similar questions and additional content below.Similar questions
- Ross Company implemented a quality improvement program and tracked the following for the five years: By cost category as a percentage of sales for the same period of time: Required: 1. Prepare a bar graph that reveals the trend in quality cost as a percentage of sales (time on the horizontal axis and percentages on the vertical). Comment on the message of the graph. 2. Prepare a bar graph for each cost category as a percentage of sales. What does this graph tell you? 3. What if management would like to have the trend in relative distribution of quality costs? Express this as a bar graph and comment on its significance.arrow_forwardThe controller of Emery, Inc. has computed quality costs as a percentage of sales for the past 5 years (20X1 was the first year the company implemented a quality improvement program). This information is as follows: Required: 1. Prepare a trend graph for total quality costs. Comment on what the graph has to say about the success of the quality improvement program. 2. Prepare a graph that shows the trend for each quality cost category. What does the graph have to say about the success of the quality improvement program? Does this graph supply more insight than the total cost trend graph does? 3. Prepare a graph that compares the trend in relative control costs versus relative failure costs. Comment on the significance of this trend.arrow_forwardA marketing professor at Givens College is interested in the relationship between hours spent studying and total points earned in a course. Data collected on 156 students who took the course last semester are provided in the tile MktHrsPts. Develop a scatter chart for these data. What does the scatter chart indicate about the relationship between total points earned and hours spent studying? Develop an estimated regression equation showing how total points earned is related to hours spent studying. What is the estimated regression model? Test whether each of the regression parameters β0 and β1 is equal to zero at a 0.01 level of significance. What are the correct interpretations of the estimated regression parameters? Are these interpretations reasonable? How much of the variation in the sample values of total point earned does the model you estimated in part (b) explain? Mark Sweeney spent 95 hours studying. Use the regression model you estimated in part (b) to predict the total points Mark earned.arrow_forward
- Assume you have asked your data folks to determine the relationship between customer service scores (i.e. the ratings provided by customers in response to a survey) and profit. The analyst reports the following: "I gathered data for the last 48 months and ran a regression where profit in a given month is the dependent variable and customer service score in that same month is the independent variable. I found an intercept of $10,000 (p-value: 0.31) and the coefficient on customer service score is $1,200 (p-value: 0.22). The R-2 (which is appropriate when there is just one independent variable) is 0.07." What do you infer from the results (two to three sentences, sticking to the information provided) and why?arrow_forwardThe following list gives a number of measures associated with the Balanced Scorecard:a. Number of new customersb. Percentage of customer complaints resolved with one contactc. Unit product costd. Cost per distribution channele. Suggestions per employeef. Warranty repair costsg. Consumer satisfaction (from surveys)h. Cycle time for solving a customer problemi. Strategic job coverage ratioj. On-time delivery percentagek. Percentage of revenues from new productsRequired:1. Classify each performance measure as belonging to one of the following perspectives:financial, customer, internal business process, or learning and growth.2. Suggest an additional measure for each of the four perspectives.arrow_forward1. How would a product life-cycle income statement differ from the above income statements? 2. Prepare a three-year life-cycle income statement for both products. Which product appears to be more profitable and why? 3. Prepare a schedule showing each cost category as a percentage of total annual costs. What do you think this indicates about the profitability of each product over the three-year life cycle?arrow_forward
- Matching graphs with descriptions of cost and revenue behavior. (D. Green, adapted) Given here are a number of graphs. The horizontal axis of each graph represents the units produced over the year, and the vertical axis represents total cost or revenues. Indicate by number which graph best fits the situation or item described (a–h). Some graphs may be used more than once; some may not apply to any of the situations. Direct material costs Supervisors’ salaries for one shift and two shifts A cost-volume-profit graph Mixed costs—for example, car rental fixed charge plus a rate per mile driven Depreciation of plant, computed on a straight-line basis Data supporting the use of a variable-cost rate, such as manufacturing labor cost of $14 per unit produced Incentive bonus plan that pays managers $0.10 for every unit produced above some level of production Interest expense on $2 million borrowed at a fixed rate of interestarrow_forwardPrepare a cost of quality report. Round the percents of total quality cost to the nearest whole number and the percents of total sales to one decimal place. Cost of Quality Report Percent of Total Quality Quality Cost Classification Quality Cost Percent of Total Sales Cost Prevention Appraisal Internal failure External failure Total % 1.1.0.0.0 % % % % %arrow_forwardAdams Corporation evaluates divisional managers based on Return on Investment (ROI) and has provided the operating results of the Northern DIVislon from last year. The Controller has asked you to compute the ROI and Residual Income based on data from last year and If the alvislon adds a new product line. Use the Information Included in the Excel Simulation and the Excel functions described below to complete the task. • Cell Reference: Allows you to refer to data from another cell in the worksheet. From the Excel Simulation below, if in a blank cell, "=G5" was entered, the formula would output the result from cell G5, or 4.00 In this example. • Basic Math functions: Allows you to use the basic math symbols to perform mathematical functions. You can use the following keys: - (plus sign to add), - (minus sign to subtract). * (asterisk sign to multiply), and (forward slash to divide). From the Excel Simulation below, If in a blank cell "=G5-G6" was entered, the formula would add the values…arrow_forward
- Fernando Garza's firm wishes to use factor rating to help select an outsourcing provider of logistics services. a) With weights from 1 - 5 (5 being the highest) and ratings from 1 100 (100 being the highest), use the following table to help Garza make his decision. In the following table, compute the weighted average score for each of the three companies (enter your responses rounded to one decimal place). Weight Overnight Criterion Quality Delivery Cost (W) Shipping Worldwide Delivery United Freight 5 88 80 72 3 71 90 72 2 71 85 97 Weighted average score: 79.5 84 77 The best outsource provider is Worldwide Delivery b) Garza decides to increase the weights for quality, delivery, and cost to 10, 6, and 4, respectively. If each weight is doubled, the best outsource provider is Worldwide Delivery . How does this change your conclusions? A. The conclusion changes since the weighted averages change. B. The conclusion does not change but the weighted averages change. C. The conclusion…arrow_forwardThe management of International Cookwares believes that delivery performance measures must be improved if the company is to maintain its competitive edge. The following data are considered to be typical of the time to complete orders. Process time: 4 days Wait time to the start of production: 15 days Move time: 3 days Inspection time: 2 days Queue time during the production process: 8 days What is the manufacturing cycle efficiency?arrow_forwardUse the data points provided in the attached Excel file to calculate the following: Show the formulas used for each cell. 1. The Annual Usage - 2. The Cumulative Ratio of Annual Usage (%) 3. The Cumulative Ratio of Usage Value (%) and ABC classification.arrow_forward
arrow_back_ios
SEE MORE QUESTIONS
arrow_forward_ios
Recommended textbooks for you
 Managerial Accounting: The Cornerstone of Busines...AccountingISBN:9781337115773Author:Maryanne M. Mowen, Don R. Hansen, Dan L. HeitgerPublisher:Cengage Learning
 Cornerstones of Cost Management (Cornerstones Ser...AccountingISBN:9781305970663Author:Don R. Hansen, Maryanne M. MowenPublisher:Cengage Learning
 Managerial AccountingAccountingISBN:9781337912020Author:Carl Warren, Ph.d. Cma William B. TaylerPublisher:South-Western College Pub
 Essentials of Business Analytics (MindTap Course ...StatisticsISBN:9781305627734Author:Jeffrey D. Camm, James J. Cochran, Michael J. Fry, Jeffrey W. Ohlmann, David R. AndersonPublisher:Cengage Learning
 Excel Applications for Accounting PrinciplesAccountingISBN:9781111581565Author:Gaylord N. SmithPublisher:Cengage Learning
 Principles of Cost AccountingAccountingISBN:9781305087408Author:Edward J. Vanderbeck, Maria R. MitchellPublisher:Cengage Learning
Managerial Accounting: The Cornerstone of Busines...
Accounting
ISBN:9781337115773
Author:Maryanne M. Mowen, Don R. Hansen, Dan L. Heitger
Publisher:Cengage Learning
Cornerstones of Cost Management (Cornerstones Ser...
Accounting
ISBN:9781305970663
Author:Don R. Hansen, Maryanne M. Mowen
Publisher:Cengage Learning
Managerial Accounting
Accounting
ISBN:9781337912020
Author:Carl Warren, Ph.d. Cma William B. Tayler
Publisher:South-Western College Pub
Essentials of Business Analytics (MindTap Course ...
Statistics
ISBN:9781305627734
Author:Jeffrey D. Camm, James J. Cochran, Michael J. Fry, Jeffrey W. Ohlmann, David R. Anderson
Publisher:Cengage Learning
Excel Applications for Accounting Principles
Accounting
ISBN:9781111581565
Author:Gaylord N. Smith
Publisher:Cengage Learning
Principles of Cost Accounting
Accounting
ISBN:9781305087408
Author:Edward J. Vanderbeck, Maria R. Mitchell
Publisher:Cengage Learning
Inspection and Quality control in Manufacturing. What is quality inspection?; Author: Educationleaves;https://www.youtube.com/watch?v=Ey4MqC7Kp7g;License: Standard youtube license