
Videos
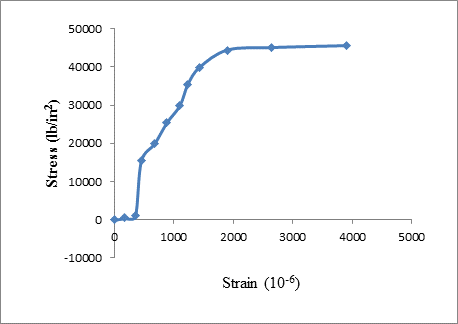
The results of a tensile test are shown in Table 1.5.2. The test was performed on a metal specimen with a circular cross section. The diameter was
a. Use the data in Table 1.5.2 to produce a table of stress and strain values.
b. Plot the stress-strain data and draw a best-fit curve.
c. Compute the, modulus of elasticity from the initial slope of the curve.
d. Estimate the yield stress.

Trending nowThis is a popular solution!

Chapter 1 Solutions
Steel Design (Activate Learning with these NEW titles from Engineering!)
Additional Engineering Textbook Solutions
Materials for Civil and Construction Engineers (4th Edition)
Foundation Design: Principles and Practices (3rd Edition)
Structural Analysis (10th Edition)
Structural Steel Design (6th Edition)
Elementary Surveying: An Introduction To Geomatics (15th Edition)
Elementary Surveying (14th Edition)


- The results of a tensile test are shown in Table 1.5.2. The test was performed on a metal specimen with a circular cross section. The diameter was 3⁄8 inch and the gage length (the length over which the elongation is measured) was 2 inches. a. Use the data in Table 1.5.2 to produce a table of stress and strain values. b. Plot the stress–strain data and draw a best-fit curve. c. Compute the modulus of elasticity from the initial slope of the curve. d. Estimate the yield stressarrow_forwardThe tensile test was conducted on a specimen with a diameter of 0.5 inch. A strain gage was bonded to the specimen so that the strain could be obtained directly. The following data were obtained. a) create a table of stress and strain values. Plot this data points and draw the best fit straight line through them. b) what is the slope of this line? What does this value represent?arrow_forward1.5-6 The data shown in the table were obtained from a tensile test of a metal specimen with a diameter of 0.500 inch and a gage length (the length over which the elongation is measured) of 2.00 inches. The specimen was not loaded to failure. a. Generate a table of stress and strain values. b. Plot these values and draw a best-fit line to obtain a stress-strain curve. c. Use the slope of the best-fit line to estimate the modulus of elasticity. Load (kips) PI223 SIN 0 2.5 3.5 10 11.5 12 Elongation (in.) 0 0.0010 0.0014 0.0020 0.0024 0.0036 0.0044 0.0050 0.0060 0.0070 0.0080 0.0120 0.0180arrow_forward
- A tensile test was performed on a metal specimen having a circular cross section with a diameter of 0.510 inch. For each increment of load applied, the strain was directly determined by means of a strain gage attached to the specimen. The results are shown in Table 1.1.a. Prepare a table of stress and strainb. Plot these data to obtain a stress-strain curve. Do not connect the data points; draw a best-fit straight line through them.c. Determine the modulus of elasticity as the slope of the best-fit lineLoad (Ib)Strain × 106 (in./in.)0025037.150070.31000129.11500230.12000259.42500372.43000457.73500586.5arrow_forward1.5-7 The data shown in the table were obtained from a tensile test of a metal specimen with a rectangular cross section of 0.2 in.² in area and a gage length (the length over which the elongation is measured) of 2.000 inches. d. Estimate the value of the proportional limit. e. Use the 0.2% offset method to determine the yield stress. Load (kips) 0 0.5 1.0 1.5 2.0 2.5 3.0 3.5 4.0 4.5 5.0 ܩܙ ܘ 5.5 6.0 6.5 Elongation × 10³ (in.) 0 0.160 0.352 0.706 1.012 1.434 1.712 1.986 2.286 2.612 2.938 3.274 3.632 3.976 Load (kips) 7.0 7.5 8.0 8.5 9.0 9.5 10.0 10.5 11.0 11.5 12.0 12.5 13 Elongation × 10³ (in.) 4.386 4.640 4.988 5.432 5.862 6.362 7.304 8.072 9.044 11.310 14.120 20.044 29.106arrow_forwardThe (G-E) diagram obtained in the tensile test performed on a metal sample with a diameter of 16 mm is as follows. The loads at points A, B and C and the elongation measured on l. 16 cm gauge length were determined as follows: B A B C Load (kgf) 4800 8400 7200 Elongation (mm) 0.192 28.8 38.4 a) Calculate the proportionality limit, modulus of elasticity, tensile strength, maximum uniform elongation, and contraction-elongation ratio of the metal. b) Since the measured diameter of the metal at break is 12 mm, find the constriction ratio and the actual stress at break.arrow_forward
- 1.16 The stress-strain relationship shown in Figure P1.16 was obtained during the tensile test of an aluminum alloy specimen. 60,000 H Stress, psi 40,000 20,000 0 Figure P1.16 0.002 0.004 0.006 0.008 Strain, in./in. Determine the following: a. Young's modulus within the linear portion. b. Tangent modulus at a stress of 45,000 psi c. Yield stress using an offset of 0.002 strain d. If the yield stress in part c is considered failure stress, what is the maximum working stress to be applied to this material if a factor of safety of 1.5 is used? 4arrow_forward2.31 A uniaxial test was performed on a bone specimen having a central (gauge) region initially 6 mm long and 2 mm in diameter. Five data points were recorded: Axial force (N) 94 190 284 376 440 Change in length (mm) 0.009 0.018 0.027 0.050 0.094 Plot the associated stress-strain relation, calculate a Young's modulus, and show that the yield stress is ~118 MPa. Recall that the yield stress reveals the transition from elastic to plastic (cf. Fig. 2.25). Data from Özkaya and Nordin (1999).arrow_forwardA tensile test specimen having a diameter of 10 mm and a gage length of 50 mm was tested to fracture. The stress-strain curve from the tension test is shown below. The lower plot is the expanded region OAB and associated with the strain values given in the lower scale. Showing your points and construction on graphs and the associated calculations, determine the following quantities. Proportional limit: _____ Rupture stress: _____ Secant modulus at stress level of 420 MPa: _____ Tangent modulus at stress level of 420 MPa: _____ Determine the plastic strain at stress level of 420 MPa: _____ If the shear modulus of the material is 55GPa, determine the Poisson’s ratio assuming the material is isotropic. _____ Determine the axial force acting on the specimen when it is extended by 0.2 mm. _____arrow_forward
- A tension test performed on a metal specimen to fracture produced the stress-strain relationship shown in Figure. Graphically determine the following (show units and all work):a. Modulus of elasticity within the linear portion.b. Yield stress at an offset strain of 0.002 in./in.c. Yield stress at an extension strain of 0.005 in/in.d. Secant modulus at a stress of 62 ksi.e. Tangent modulus at a stress of 65 ksi.arrow_forwardA tension test performed on a metal specimen to fracture produced the stress– strain relationship shown in Figure P1.14. Graphically determine the following (show units and all work): a. Modulus of elasticity within the linear portion. b. Yield stress at an offset strain of 0.002 m/m. c. Yield stress at an extension strain of 0.005 m/m. d. Secant modulus at a stress of 525 MPa. e. Tangent modulus at a stress of 525 MPa.arrow_forward2. A steel bar, whose cross section is 0.55 inch by 4.05 inches, was tested in tension. An axial load of P = 30,500 lb. produced a deformation of 0.105 inch over a gauge length of 2.05 inches and a decrease of 0.0075 inch in the 0.55-inch thickness of the bar. * Determine the lateral strain. Your answer Determine the axial strain. Your answer Determine the Poisson's rati v. Your answer Determine the decrease in the 4.05-in. cross-sectional dimension (in inches). * Your answerarrow_forward
 Steel Design (Activate Learning with these NEW ti...Civil EngineeringISBN:9781337094740Author:Segui, William T.Publisher:Cengage Learning