
A
To describe:Based on the given data and information, prove that the P=3 is the
A
Answer to Problem 1.2P
If there is a rise in the
Explanation of Solution
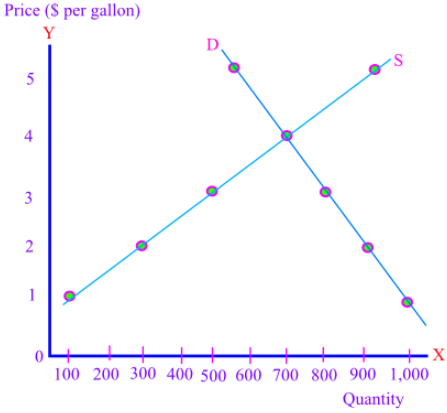
| Price | Quantity Supplied | Quantity Demanded |
| 1 | 100 | 700 |
| 2 | 300 | 600 |
| 3 | 500 | 500 |
| 4 | 700 | 400 |
| 5 | 900 | 300 |
By observing the above table, it can be seen that at a market price of 3, the quantity supplied equals to the quantity demanded. Hence, the equilibrium price is 3.
Introduction: The price at which the quantity of goods supplied is equal to the quantity of goods supplied is referred to as the market price.
B
To describe:
Based on the given and arrived at data, find out the reasons behind the prices 2 and 4 not being equilibrium prices.
B
Answer to Problem 1.2P
If there is a fall in the demand for the e-book as it is following the change in the prices of e-books it would result in an increase of complement.
Explanation of Solution
| Price | Quantity Supplied | Quantity Demanded |
| 1 | 100 | 700 |
| 2 | 300 | 600 |
| 3 | 500 | 500 |
| 4 | 700 | 400 |
| 5 | 900 | 300 |
By observing the above table, at a price of 2 the quantity supplied is lower than the quantity demanded, and hence it is not the equilibrium price.
Similarly, at the price of 4, the quantity demanded is more than the quantity supplied, and hence it is not the equilibrium price.
Introduction: The price at which the quantity of goods supplied is equal to the quantity of goods supplied is referred to as the market price.
C
To describe:
Graph the results of previous parts and show that the equilibrium price is achieved.
C
Answer to Problem 1.2P
If there is a rise in the demand for tablet devices which can eventually be following a change in the price of ultrathin laptop computers, that also happen to be the substitutes can result in increase in pricing.
Explanation of Solution
Upon observing the graph, as usual, it can be noticed that the supply curve and demand curve are intersecting at a price level of 3.
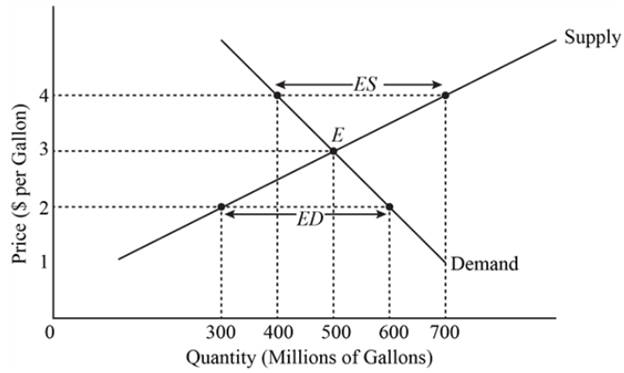
Hence, it can be concluded that the equilibrium price is 3.
Introduction: The price at which the quantity of goods supplied is equal to the quantity of goods supplied is referred to as the market price.
D
To describe:
Supposing the given assumption, possibility of the change in the data given in earlier problem.
D
Answer to Problem 1.2P
If there is also a fall in the demand for physical books it can result in following a change in the price of e-books which are also substitutes can result in the decrease of the prices.
Explanation of Solution
Provided that the people now are demanding 300 more quantity at every price change, the demand will be changed and can be observed in the given table:
| Price | Quantity Supplied | Quantity Demanded |
| 1 | 100 | 1000 |
| 2 | 300 | 900 |
| 3 | 500 | 800 |
| 4 | 700 | 700 |
| 5 | 900 | 600 |
In the resulting graph as shown below, the change in the quantity demanded would shift the demand curve outward:
Introduction: The price at which the quantity of goods supplied is equal to the quantity of goods supplied is referred to as the equilibrium price.
E
To describe:
Given the proposed change in the demand, outline the result in the graph.
E
Answer to Problem 1.2P
If there is also a fall in the demand for physical books it can result in following a change in the price of e-books which are also substitutes can result in the decrease of the prices.
Explanation of Solution
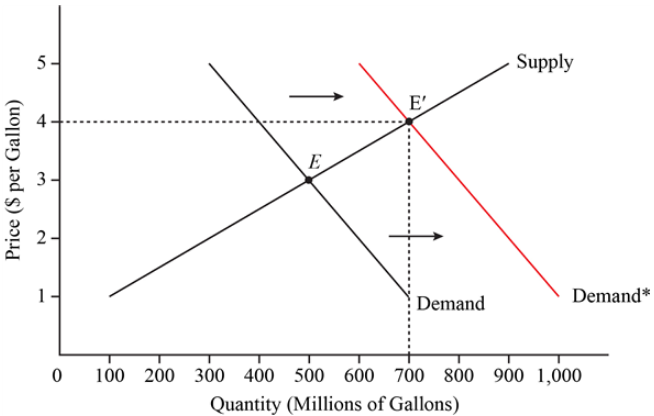
The proposed increase in the demand would change the equilibrium to new equilibrium represented by E1, for the new equilibrium price of P=4.
Introduction: The price at which the quantity of goods supplied is equal to the quantity of goods supplied is referred to as the equilibrium price.
F
To describe:
Find out the change in pattern for the given supply demanded.
F
Answer to Problem 1.2P
If there is also a fall in the demand for physical books it can result in following a change in the price of e-books which are also substitutes can result in the decrease of the prices.
Explanation of Solution
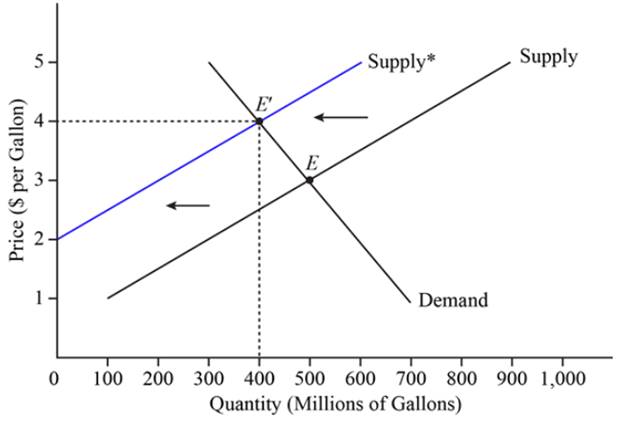
With the given new supply demanded at every price, observe the given table for the resulting changes:
| Price | Quantity Supplied | Quantity Demanded |
| 1 | 0 | 700 |
| 2 | 0 | 600 |
| 3 | 200 | 500 |
| 4 | 400 | 400 |
| 5 | 600 | 300 |
Such a change in the supply pattern would shift the supply curve to the inward.
Introduction: The price at which the quantity of goods supplied is equal to the quantity of goods supplied is referred to as the equilibrium price.
G
To describe:
Find out the equilibrium price in the market with the new supply relationship together with the demand relationship.
G
Answer to Problem 1.2P
If there is also a fall in the demand for physical books it can result in following a change in the price of e-books which are also substitutes can result in the decrease of the prices.
Explanation of Solution
With the given new supply demanded at every price, observe the given table for the resulting changes:
| Price | Quantity Supplied | Quantity Demanded |
| 1 | 0 | 700 |
| 2 | 0 | 600 |
| 3 | 200 | 500 |
| 4 | 400 | 400 |
| 5 | 600 | 300 |
The new equilibrium price would be P=4, at the given quantity supplied and the quantity demanded.
Introduction: The price at which the quantity of goods supplied is equal to the quantity of goods supplied is referred to as the equilibrium price.
H
To describe:
With the new demand and supply quantity relationships, observe the change in equilibrium price.
H
Answer to Problem 1.2P
If there is also a fall in the demand for physical books it can result in following a change in the price of e-books which are also substitutes can result in the decrease of the prices.
Explanation of Solution
With the reduce in the supply and excess of demand at P=3, the result is that it is no more an equilibrium price.
This because, the supply and demand are not any more the same for the given price, and hence, the price is not any more an equilibrium price.
Introduction: The price at which the quantity of goods supplied is equal to the quantity of goods supplied is referred to as the equilibrium price.
I
To describe:
For the observed results at the supply shift, put out a graph.
I
Answer to Problem 1.2P
If there is also a fall in the demand for physical books it can result in following a change in the price of e-books which are also substitutes can result in the decrease of the prices.
Explanation of Solution
Introduction: The price at which the quantity of goods supplied is equal to the quantity of goods supplied is referred to as the equilibrium price.
Want to see more full solutions like this?
Chapter 1 Solutions
EBK INTERMEDIATE MICROECONOMICS AND ITS

- Using the supply and demand functions below, derive the demand and supply curves if Y=$55,000 and pc=$13. What is the equilibrium price and quantity of coffee? Part 2 The demand function for coffee is Q=8.5−p+0.01Y, where Q is the quantity of coffee in millions of pounds per year, p is the price of coffee in dollars per pound, and Y is the average annual household income in high-income countries in thousands of dollars. The coffee supply function is Q=9.6+0.5p−0.2pc, where pc is the price of cocoa in dollars per pound. Part 3 The equilibrium price of coffee is p=$enter your response here per pound and the equilibrium quantity is Q=enter your response here millions of pounds per year. (Enter your responses rounded to two decimal places.)arrow_forwardSuppose we are analyzing the market for hot chocolate. Graphically illustrate the impact each of the following would have on demand or supply. Also show how equilibrium price and quantity have changed. Consumer income falls because of a recession and hot chocolate is considered a normal good. Producers expect the price of hot chocolate to increase next month. Currently, the price of hot chocolate is $0.50 per cup above equilibrium.arrow_forwardConsider the following two equations for the demand and supply: Supply curve: Qs = 10 + 2P Demand curve: Qd = 30 − 12P (a) What is the value of the equilibrium price? (b) What is the equilibrium quantity? Suppose that clothes workers at a certain factory accept a pay cut of $3 per hour. (a) Draw a graph to show how this would affect the market for clothes. (b) Why does this shift occur? How does that affect the equilibrium price and quantity? Suppose that the price of product A increases from $10 to $19. As a result, quantity demanded for product B changes from 300 to 265. What can we say about products A and B? Explain.arrow_forward
- Consider the market for hazelnuts. Use the supply and demand model to explain the effect of the following scenarios on the equilibrium price (P*) and the equilibrium quantity (Q*) of hazelnuts. In each of the following scenarios, does the supply curve shift? Does the demand curve shift? If there is a shift of the supply and/ or the demand curve, in what direction? Show graphically. Does the equilibrium price of hazelnuts increase or decrease? Does the equilibrium quantity of hazelnuts increase or decrease? 1. Adverse weather conditions destroy a large amount of hazelnut trees in Turkey, the leading hazelnut producer in the world. 2. The Italian company Ferrero makes a decision to increase the hazelnut content in its Nutella cocoa hazelnut spread. 3. New research finds that hazelnuts lower cholesterol and improve heart health more than people previously thought, and lots of people become aware of the results of the new study.arrow_forwardYou are advising Roy on the opening of his Original-Original Famous Pizzeria. By plotting the points below on a coordinate plane, you can show Roy the price points that would lead to a shortage of slices, a surplus of slices, and the point of maximum efficiency per slice. On the graph paper below: label your vertical axis with prices and your horizontal axis with quantity, plot each point of the demand and draw the curve with one color. plot each point of supply and draw the curve with a different color, identify the equilibrium point on your grapharrow_forwardConsider the market for hazelnuts. Use the supply and demand model to explain the effect of the following scenarios on the equilibrium price (P*) and the equilibrium quantity (Q*) of hazelnuts. In each of the following scenarios, does the supply curve shift? Does the demand curve shift? If there is a shift of the supply and/ or the demand curve, in what direction? Show graphically. Does the equilibrium price of hazelnuts increase or decrease? Does the equilibrium quantity of hazelnuts increase or decrease? 1. The price of almonds, a substitute for hazelnuts, decreases significantly. 2. Hazelnut producers discover a method to pick hazelnuts more efficiently which significantly reduces the cost of hazelnut production. 3. Hazelnut consumers’ incomes increase, and a new location where the climate is appropriate for growing lots of hazelnuts has been discovered. Assume that hazelnuts are a normal good.arrow_forward
- Draw a demand and supply graph for each of the following questions. For each question, start by drawing a correctly labeled graph of the market for cookies in equilibrium. Your starting graphs should each have correctly labeled axes and demand and supply curves. Label the equilibrium price and quantity as p1 and p2 on the axes of each of the starting graphs. Show the effect on the equilibrium price and quantity in the market for cookies if the price of flour decreases. Determine which curve is affected by the change in the price of flour and whether it increases or decreases. On your graph, draw a new curve indicating the shift—either to the right or the left. Label the new equilibrium price and quantity as p2 and q2.arrow_forwardConsider the market for pens. Suppose that the number of students with an allergy to pencil erasers increases, causing more students to switch from pencils to pens in school. Moreover, the price of ink, an important input in pen production, has dropped considerably. On the following graph, labeled Scenario 1, indicate the effect these two events have on the demand for and supply of pens. Note: Select and drag one or both of the curves to the desired position. Curves will snap into position, so if you try to move a curve and it snaps back to its original position, just drag it a little farther. 10 1 0 2 Scenario 1 Equilibrium Object Price Quantity Supply True False Demand QUANTITY (Mons of pens) Next, complete the following graph, labeled Scenario 2, by shifting the supply and demand curves In the same way that you did on the Scenario 1 graph. Scenario 2 Supply Demand QUANTITY() '0 Demand 9 10 Scenario 1 Supply Demand (?) Supply Compare both the Scenario 1 and Scenario 2 graphs. Notice…arrow_forwardCassava is the main commodity in the economy of Makandingi. Given the hardship in the economy, the government increased the salary of all employees in Makandingi. Following this intervention, the number of cassava producers also increased in the community. In a class discussion, Barnabas said these two events would result in an increase in equilibrium price of cassava. Francis, on the other hand, argued that the price would rather decrease. With the aid of a diagram, explain the possible effects of the two events on equilibrium price and quantity, assuming the salary increase has a greater impact and cassava is a normal good.arrow_forward
- Suppose the supply of a good is given by the equation Q = −6+2P and the demand for the good is given by the equation QD = 14 - 2P, where quantity (Q) is measured in millions of units and price (P) is measured in dollars per unit. The equilibrium quantity in this market is 4 million PRICE (Dollars per unit) the following graph, plot the demand curve using the blue line (circle symbol) and plot the supply curve using the orange line (square symbol). Then place the black point (plus symbol) at the equilibrium price and quantity. Dashed drop lines will automatically extend to both axes. 10 9 8 7 2 1 0 0 1 2 3 4 5 6 7 QUANTITY (Millions of units) 8 units and the equilibrium price is 9 10 Demand Supply $5. Equilibriumarrow_forward2.5 This problem involves solving demand and supply equations together to determine price and quantity. a. Consider a demand curve of the form QD=-2P+20, where QD is the quantity demanded of a good and P is the price of the good. Graph this demand curve. Also draw a graph of the supply curve Qs =2P-4, where Qs is the quantity supplied. Be sure to put P on the vertical axis and Q on the horizontal axis. Assume that all the Qs and Ps are nonnegative for parts a, b, and c. At what values of P and Q do these curves intersect-that is, where does QD = Qs ? b. Now, suppose at each price that individuals demand four more units of output-that the demand curve shifts to QD - 2P+24. Graph this new demand curve. At what values of P and Q does the new demand curve intersect the old supply curve-that is, where does QD = Qs ? c. Now finally, suppose the supply curve shifts to Q's=2P-8. Graph this new supply curve. At what values of P and Q does QD Q's? You may wish to refer to this simple problem…arrow_forwardUsing the supply and demand functions below, derive the demand and supply curves if Y = $55,000 and p. =$14. What is the equilibrium price and quantity of coffee? The demand function for coffee is Q = 8.5 -p+0.01Y, where Q is the quantity of coffee in millions of pounds per year, p is the price of coffee in dollars per pound, and Y is the average annual household income in high-income countries in thousands of dollars. The coffee supply function is Q = 9.6 + 0.5p – 0.2pc. where p, is the price of cocoa in dollars per pound. The equilibrium price of coffee is p=$ per pound and the equilibrium quantity is Q = millions of pounds per year. (Enter your responses rounded to two decimal places.)arrow_forward
 Exploring EconomicsEconomicsISBN:9781544336329Author:Robert L. SextonPublisher:SAGE Publications, Inc
 Economics (MindTap Course List)EconomicsISBN:9781337617383Author:Roger A. ArnoldPublisher:Cengage Learning