
Essentials of Business Analytics (MindTap Course List)
2nd Edition
ISBN: 9781305627734
Author: Jeffrey D. Camm, James J. Cochran, Michael J. Fry, Jeffrey W. Ohlmann, David R. Anderson
Publisher: Cengage Learning
expand_more
expand_more
format_list_bulleted
Videos
Textbook Question
Chapter 15, Problem 8P
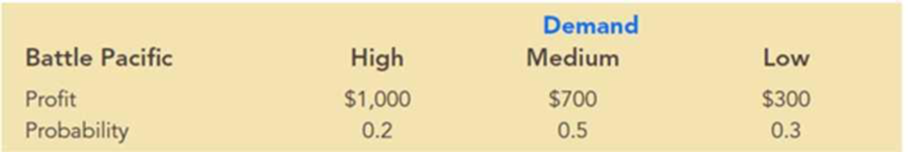
Video Tech is considering marketing one of two new video games for the coming holiday season: Battle Pacific or Space Pirates. Battle Pacific is a unique game and appears to have no competition. Estimated profits (in thousands of dollars) under high, medium, and low demand are as follows:
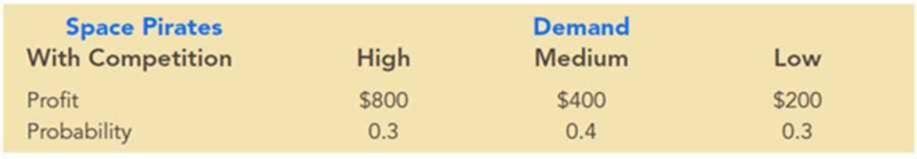
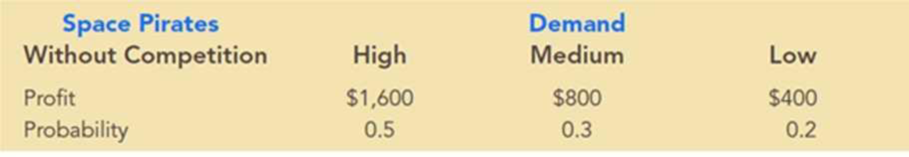
Video Tech is optimistic about its Space Pirates game. However, the concern is that profitability will be affected by a competitor’s introduction of a video game viewed as similar to Space Pirates. Estimated profits (in thousands of dollars) with and without competition are as follows:
- a. Develop a decision tree for the Video Tech problem.
- b. For planning purposes, Video Tech believes there is a 0.6
probability that its competitor will produce a new game similar to Space Pirates. Given this probability of competition, the director of planning recommends marketing the Battle Pacific video game. Usingexpected value , what is your recommended decision? - c. Show a risk profile for your recommended decision.
- d. Use sensitivity analysis to determine what the probability of competition for Space Pirates would have to be for you to change your recommended decision alternative.
Expert Solution & Answer

Trending nowThis is a popular solution!

Students have asked these similar questions
University researchers published a working paper. One of the objectives of the study was to determine whether ride-share drivers actually make a profit.
Companies in the U.S. car rental market vary greatly in terms of the size of the fleet, the number of locations, and annual revenue. In 2011, Hertz had 320,000 cars in service and annual revenue of approximately $4.2 billion. Suppose the following data show the number of cars in service (1,000s) and the annual revenue ($ millions) for six smaller car rental companies.
Company
Cars(1,000s)
Revenue($ millions)
Company A
11.5
116
Company B
10.0
133
Company C
9.0
98
Company D
5.5
37
Company E
4.2
40
Company F
3.3
32
a.Use the least squares method to develop the estimated regression equation that can be used to predict annual revenue (in $ millions) given the number of cars in service (in 1,000s). (Round your numerical values to three decimal places.)
b.
For every additional car placed in service, estimate how much annual revenue will change (in dollars). (Round your answer to the nearest integer.)
Annual revenue will increase by $ , for every additional car placed in…
Companies in the U.S. car rental market vary greatly in terms of the size of the fleet, the number of locations, and annual revenue. In 2011, Hertz had 320,000 cars in service and annual revenue of approximately $4.2 billion. Suppose the following data show the number of cars in service (1,000s) and the annual revenue ($ millions) for six smaller car rental companies.
Company
Cars (1,000s)
Revenue ($ millions)
Company A
11.5
116
Company B
10
137
Company C
9
102
Company D
5.5
39
Company E
4.2
38
Company F
3.3
30
(a)
Develop a scatter diagram with the number of cars in service as the independent variable.
(b)
What does the scatter diagram developed in part (a) indicate about the relationship between the two variables?
(c)
Use the least squares method to develop the estimated regression equation that can be used to predict annual revenue (in $ millions) given the number of cars in service (in 1,000s). (Round your numerical values to three decimal…
Chapter 15 Solutions
Essentials of Business Analytics (MindTap Course List)
Ch. 15 - Prob. 1PCh. 15 - Southland Corporation’s decision to produce a new...Ch. 15 - Amy Lloyd is interested in leasing a new Honda and...Ch. 15 - Investment advisors estimated the stock market...Ch. 15 - Hudson Corporation is considering three options...Ch. 15 - Prob. 6PCh. 15 - Myrtle Air Express decided to offer direct service...Ch. 15 - Video Tech is considering marketing one of two new...Ch. 15 - Seneca Hill Winery recently purchased land for the...Ch. 15 - Hemmingway, Inc. is considering a $5 million...
Ch. 15 - The following profit payoff table was presented in...Ch. 15 - Suppose that you are given a decision situation...Ch. 15 - A firm has three investment alternatives. Payoffs...Ch. 15 - Alexander Industries is considering purchasing an...Ch. 15 - In a certain state lottery, a lottery ticket costs...Ch. 15 - Three decision makers have assessed utilities for...Ch. 15 - In Problem 22, if P(s1) = 0.25, P(s2) = 0.50, and...Ch. 15 - Translate the following monetary payoffs into...Ch. 15 - Consider a decision maker who is comfortable with...
Knowledge Booster


Learn more about
Need a deep-dive on the concept behind this application? Look no further. Learn more about this topic, statistics and related others by exploring similar questions and additional content below.Similar questions
- If during the following year it is predicted that each comedy skit will generate 30 thousand and each musical number 20 thousand, find the maximum income for the year. A television program director must schedule comedy skits and musical numbers for prime-time variety shows. Each comedy skit requires 2 hours of rehearsal time, costs 3000, and brings in 20,000 from the shows sponsors. Each musical number requires 1 hour of rehearsal time, costs 6000, and generates 12,000. If 250 hours are available for rehearsal and 600,000 is budgeted for comedy and music, how many segments of each type should be produced to maximize income? Find the maximum income.arrow_forwardCompanies in the U.S. car rental market vary greatly in terms of the size of the fleet, the number of locations, and annual revenue. In 2011, Hertz had 320,000 cars in service and annual revenue of approximately $4.2 billion. Suppose the following data show the number of cars in service (1,000s) and the annual revenue ($ millions) for six smaller car rental companies. Company Cars(1,000s) Revenue($ millions) Company A 11.5 118 Company B 10.0 133 Company C 9.0 98 Company D 5.5 37 Company E 4.2 40 Company F 3.3 30 (a) Develop a scatter diagram with the number of cars in service as the independent variable. A scatter diagram has 6 points plotted on it. The horizontal axis ranges from 0 to 14 and is labeled: Cars in Service (1,000s). The vertical axis ranges from 0 to 160 and is labeled: Annual Revenue ($ millions). The points are plotted from left to right in an upward, diagonal direction starting from the lower left corner of the diagram and are between 3 to 12 on…arrow_forwardOHaganBooks.com has two principal competitors: JungleBooks.com and FarmerBooks.com. Combined website traffic at the three sites is estimated at 14000 hits per day. FarmerBooks.com appears to be the most successful of the three and gets as many book hits as the other two combined. Önly 10% of the hits at OHaganBooks.com result in orders, whereas JungleBooks.com and FarmerBooks.com both report that 18% of the hits at their sites result in book orders and together, the three sites process 2000 book orders per day. What is the traffic (in hits per day) at each of the sites? OHaganBooks.com gets hits per day. JungleBooks.com gets hits per day FarmerBooks.com.gets hits per dayarrow_forward
arrow_back_ios
arrow_forward_ios
Recommended textbooks for you
 College Algebra (MindTap Course List)AlgebraISBN:9781305652231Author:R. David Gustafson, Jeff HughesPublisher:Cengage Learning
College Algebra (MindTap Course List)
Algebra
ISBN:9781305652231
Author:R. David Gustafson, Jeff Hughes
Publisher:Cengage Learning
Hypothesis Testing using Confidence Interval Approach; Author: BUM2413 Applied Statistics UMP;https://www.youtube.com/watch?v=Hq1l3e9pLyY;License: Standard YouTube License, CC-BY
Hypothesis Testing - Difference of Two Means - Student's -Distribution & Normal Distribution; Author: The Organic Chemistry Tutor;https://www.youtube.com/watch?v=UcZwyzwWU7o;License: Standard Youtube License