
Concept explainers
Videos
The paper “Sociochemosensory and Emotional
One of the three shirts had been worn by the subject’s roommate. The subject was asked to identify the shirt worn by her roommate. This process was then repeated with another three shirts, and the number of times out of the two trials that the subject correctly identified the shirt worn by her roommate was recorded. The resulting data are summarized in the accompanying table.
![Chapter 12.1, Problem 10E, The paper Sociochemosensory and Emotional Functions (Psychological Science [2009]: 11181124)](https://content.bartleby.com/tbms-images/9781337793612/Chapter-12/images/93612-12.1-10e-question-digital_image_001.png)
- a. Can a person identify her roommate by smell? If not, the data from the experiment should be consistent with what we would have expected to see if subjects were just guessing on each trial. That is, we would expect that the probability of selecting the correct shirt would be 1/3 on each of the two trials.
Calculate the proportions of the time we would expect to see 0, 1, and 2 correct identifications if subjects are just guessing. (Hint: 0 correct identifications occurs if the first trial is incorrect and the second trial is incorrect.)
- b. Use the three proportions calculated in Part (a) to carry out a test to determine if the numbers of correct identifications by the students in this study are significantly different from what would have been expected by guessing. Use α = 0.05. (Note: One of the expected counts is just a bit less than 5. For purposes of this exercise, assume that it is OK to proceed with a goodness-of-fit test.)
a.
Calculate the proportion of time expected to see 0, 1, and 2 correct identifications if subjects are just guessing.
Answer to Problem 10E
When the subjects are just guessing, the proportion of time expected to see 0, 1, and 2 correct identifications are
Explanation of Solution
Calculation:
It is given that if subjects were just guessing on each trial, the probability of selecting the correct shirt would be
Thus, the probability of selecting the wrong shirt is
The proportion of 0 correct identifications expected in two trials is shown below.
The proportion of 1 correct identifications expected in two trials is shown below.
The proportion of 2 correct identifications expected in two trials is shown below
b.
Test whether the numbers of correct identifications by the students in this study are significantly different from what would have been expected by guessing at 0.05 level of significance.
Answer to Problem 10E
The numbers of correct identifications by the students in this study are significantly different from those that would have been expected by guessing.
Explanation of Solution
The given data represents the number of correct identifications of shirt worn by her roommate in two trials.
The expected counts can be calculated using the formula,
| Number of correct identification | Observed Frequency | Expected counts |
| 0 | 21 | |
| 1 | 10 | |
| 2 | 13 | |
| Total | 44 | 44 |
The nine step hypotheses testing procedure to test goodness-of-fit is given below.
1. The proportion of correct identifications are
2. Null hypothesis:
3. Alternative hypothesis:
4. Significance level:
5. Test statistic:
6. Assumptions:
- Randomness assumption is not necessary, as the question is only to test whether the observed counts differ from expected by guessing.
- From the table above, it is observed that one of the expected counts is a little less than 5. However, as per the instruction, the goodness-of-fit test can be done.
7. Calculation:
Software procedure:
Step-by-step procedure to obtain the test statistics and P-value using the MINITAB software:
- Choose Stat > Tables > Chi-Square Goodness-of-Fit Test (One Variable).
- In Observed counts, enter the column of Observed count.
- In Category names, enter the column of Number of correct identification.
- Under Test, select the column of Proportion in Proportions specified by historical counts.
- Click OK.
Output using the MINITAB software is given below:
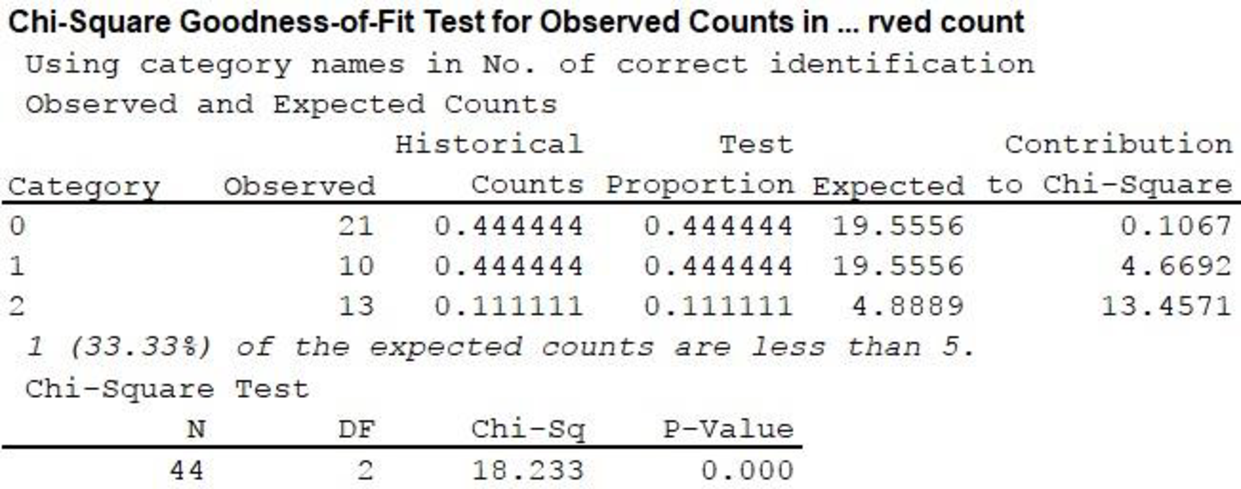
From the output,
8. P-value:
From the MINITAB output,
9. Conclusion:
Decision rule:
- If P-value is less than or equal to the level of significance, reject the null hypothesis.
- Otherwise fail to reject the null hypothesis.
Conclusion:
Here the level of significance is 0.05.
Here, P-value is less than the level of significance.
That is,
Therefore, reject the null hypothesis. Hence, the numbers of correct identifications by the students in this study are significantly different from those that would have been expected by guessing.
Want to see more full solutions like this?
Chapter 12 Solutions
Introduction To Statistics And Data Analysis


- An American Automobile Association (AAA) study investigated the question of whether car owners or truck owners were more likely to change their own blown tire. The situation referred to in the study stated the following: “If you blew a tire on a trip, would you change the tire yourself?” A sample representative of the data used by AAA showed 663 of 818 car owners said that they would change the tire themselves while 541 of 733 truck owners said they would change the tire themselves. x n car owners 663 818 truck owner 541 733 The AAA research hypothesis was that truck owners would be more likely to change their tire themselves. Formulate the null and alternative hypotheses for this study. Let car owners be population What is the percentage of car owners who indicated that they would change their own tire?arrow_forwardThe American Society for Microbiology (ASM) and the Soap and Detergent Association (SDA) jointly commissioned two separate studies during 2007, both of which were conducted by Harris Interactive. In one of the studies, 1001 adults were interviewed by telephone and asked about their hand-washing habits. In the other study, the hand-washing behavior of 6076 adults was inconspicuously observed within public restrooms in four U.S. cities. Address the following: a. In the telephone interviews, 921 of the adults said they always wash their hands in public restrooms. Use this result to obtain a point estimate for the proportion of adults who say they always wash their hands in public restrooms. b. Verify that the requirements for constructing a confidence interval for p from part (a) are satisfied. c. Using the results from the telephone interviews, construct and interpret a 95% confidence interval for the proportion of adults who say they always wash their hands in public restrooms. d. Is it…arrow_forward
 Holt Mcdougal Larson Pre-algebra: Student Edition...AlgebraISBN:9780547587776Author:HOLT MCDOUGALPublisher:HOLT MCDOUGAL
 Calculus For The Life SciencesCalculusISBN:9780321964038Author:GREENWELL, Raymond N., RITCHEY, Nathan P., Lial, Margaret L.Publisher:Pearson Addison Wesley,
 Glencoe Algebra 1, Student Edition, 9780079039897...AlgebraISBN:9780079039897Author:CarterPublisher:McGraw Hill