
Subpart (a):
Effect on Aggregate Demand and Supply.
Subpart (a):
Explanation of Solution
When consumers fear of an impending economic depression, their spending decline and they tend to save more. This leads to a decrease in AD curve. This can be explained by using figure 1.
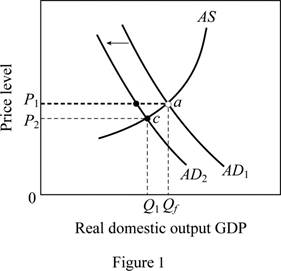
In figure 1, horizontal axis represents the real GDP(
Concept Introduction:
Aggregate demand (AD): Aggregate demand refers to the total value of the goods and services that are demanded at a particular price in a given period of time.
Subpart (b):
Effect on Aggregate Demand and Supply.
Subpart (b):
Explanation of Solution
When a new tax is imposed on producers, cost of production comes up and there is no incentive to produce more. This leads to a decline in
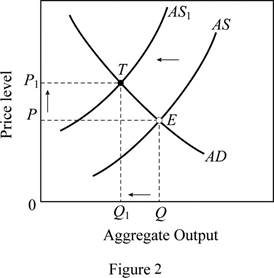
In figure 2, horizontal axis represents the real GDP and vertical axis represents price level. In this case, the AS curve shifts left (from AS to AS1), this moves the equilibrium position from E to T, thus there is a decline in the output (from Q to Q1) and a rise in the price level (from P to P1).
Concept Introduction:
Aggregate demand (AD): Aggregate demand refers to the total value of the goods and services that are demanded at a particular price in a given period of time.
Aggregate supply (AS): Aggregate supply refers to the total value of the goods and services that are available for purchase at a particular price in a given period of time.
Subpart (c):
Effect on Aggregate Demand and Supply.
Subpart (c):
Explanation of Solution
Figure 3 can explain the shift in AD curve due to reduction in interest rates at each price level. In figure 3, horizontal axis measures the real GDP and vertical axis measures the price level.
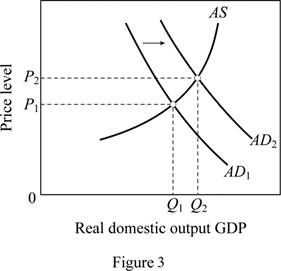
A reduction in interest rates decreases the borrowing cost increases the spending.
This leads to a rightward shift of AD curve from AD1 to AD2. Thus, it brings the output and price level up. The output increases from Q1 to Q2 and price level increases from P1 to P2.
Concept Introduction:
Aggregate demand (AD): Aggregate demand refers to the total value of the goods and services that are demanded at a particular price in a given period of time.
Aggregate supply (AS): Aggregate supply refers to the total value of the goods and services that are available for purchase at a particular price in a given period of time.
Subpart (d):
Effect on Aggregate Demand and Supply.
Subpart (d):
Explanation of Solution
A major increase in spending shifts the AD curve to right. Figure 4 is used to explain this situation. In figure 4, horizontal axis measures the real GDP and vertical axis measures the price level.
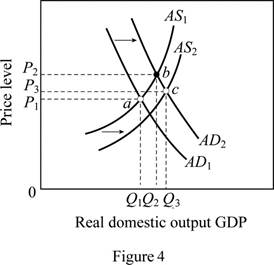
Government expenditure is a key determinant of changes in the aggregate demand. The increase in government spending (spending for health care) increases the aggregate demand leading to a shift of AD curve from AD1 to AD2. Any real improvements in healthcare resulting from the spending would ultimately increase the productivity, thereby shifting the AS curve to the right (from AS1 to AS2). The equilibrium moves from a to c leading to an increase in output (from Q1 to Q3) . It will also move the price level up from P1 to P3.
Concept Introduction:
Aggregate demand (AD): Aggregate demand refers to the total value of the goods and services that are demanded at a particular price in a given period of time.
Aggregate supply (AS): Aggregate supply refers to the total value of the goods and services that are available for purchase at a particular price in a given period of time.
Subpart (e):
Effect on Aggregate Demand and Supply.
Subpart (e):
Explanation of Solution
The general expectation of surging inflation in the near future will increase the aggregate demand today because the consumers will want to buy products before their prices escalate. This can be illustrated using figure 3. As a result, there will be a rightward shift of AD curve from AD1 to AD2 which brings the output and price level up. In figure 3, the output increases from Q1 to Q2 and price level increases from P1 to P2.
Concept Introduction:
Aggregate demand (AD): Aggregate demand refers to the total value of the goods and services that are demanded at a particular price in a given period of time.
Aggregate supply (AS): Aggregate supply refers to the total value of the goods and services that are available for purchase at a particular price in a given period of time.
Subpart (f):
Effect on Aggregate Demand and Supply.
Subpart (f):
Explanation of Solution
Figure 5 is used to explain this case. In figure 5, horizontal axis measures the real GDP and vertical axis measures the price level.
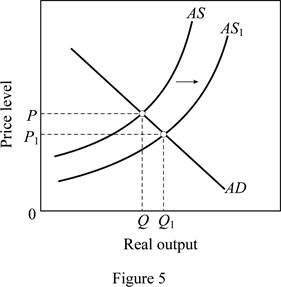
As oil prices fall (oil is an imported resource) due to the disintegration of OPEC, it increases the U.S. aggregate supply. As a result, there will be a rightward shift of AS curve from AS to AS1. This brings the output level up from Q to Q1 and price level down from P to P1.
Concept Introduction:
Aggregate demand (AD): Aggregate demand refers to the total value of the goods and services that are demanded at a particular price in a given period of time.
Aggregate supply (AS): Aggregate supply refers to the total value of the goods and services that are available for purchase at a particular price in a given period of time.
Subpart (g):
Effect on Aggregate Demand and Supply.
Subpart (g):
Explanation of Solution
A reduction in the personal income tax rates raises take-home income increases consumer purchases at each possible price level. This is illustrated in figure 3. Tax cuts shift the aggregate demand curve to the right from AD1 to AD2 which brings the output and price level up. In figure 3, the output increases from Q1 to Q2 and price level increases from P1 to P2.
Concept Introduction:
Aggregate demand (AD): Aggregate demand refers to the total value of the goods and services that are demanded at a particular price in a given period of time.
Aggregate supply (AS): Aggregate supply refers to the total value of the goods and services that are available for purchase at a particular price in a given period of time.
Subpart (h):
Effect on Aggregate Demand and Supply.
Subpart (h):
Explanation of Solution
The sizable increase the labor productivity with no change in nominal wages will increase the overall productivity as more output is available for the given input. This increases the aggregate supply thereby shifting the AS curve to the right from AS to AS1 (Refer Figure 5). This leads to an increase in output (from Q to Q1) and a decrease in price level from P to P1.
Concept Introduction:
Aggregate demand (AD): Aggregate demand refers to the total value of the goods and services that are demanded at a particular price in a given period of time.
Aggregate supply (AS): Aggregate supply refers to the total value of the goods and services that are available for purchase at a particular price in a given period of time.
Subpart (i):
Effect on Aggregate Demand and Supply.
Subpart (i):
Explanation of Solution
This case can be explained using Figure 2. When there is an increase in nominal wages with no change in productivity, it increases per unit cost of production. This force the AS curve to shift left (from AS to AS1). The equilibrium position moves from E to T, thus there are a decline in the output (from Q to Q1) and a rise in the price level (from P to P1).
Concept Introduction:
Aggregate demand (AD): Aggregate demand refers to the total value of the goods and services that are demanded at a particular price in a given period of time.
Aggregate supply (AS): Aggregate supply refers to the total value of the goods and services that are available for purchase at a particular price in a given period of time.
Subpart (j):
Effect on Aggregate Demand and Supply.
Subpart (j):
Explanation of Solution
Figure 6 shows the impact of increasing demand and decreasing supply.
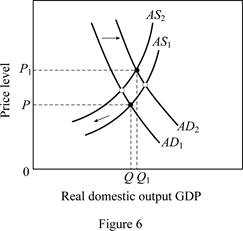
Figure 6 is used to explain this condition. The horizontal axis in Figure 6 measures the real domestic output whereas price level is measured by the vertical axis. A rise in net exports (higher exports relative to imports) shifts the aggregate demand curve to the right (from AD1 to AD2). But, due to the higher input prices, per unit cost is more, leading to a shift of the aggregate supply curve to the left from AS1 to AS2. This leads to an increase in output from Q to Q1 along with an increase in price level from P to P1.
Concept Introduction:
Aggregate demand (AD): Aggregate demand refers to the total value of the goods and services that are demanded at a particular price in a given period of time.
Aggregate supply (AS): Aggregate supply refers to the total value of the goods and services that are available for purchase at a particular price in a given period of time.
Want to see more full solutions like this?
Chapter 12 Solutions
Macroeconomics

- Suppose that the table presented below shows an economy's relationship between real output and the inputs needed to produce that output: Input Quantity Real GDP 150.0 $ 400 112.5 300 75.0 200 Instructions: Enter your responses answers rounded to 2 decimal places. a. What is the level of productivity in this economy? b. What is the per-unit cost of production if the price of each input unit is $2? $ C. Assume that the input price increases from $2 to $3 with no accompanying change in productivity. What is the new per-unit cost of production? In what direction would the $1 increase in input price push the economy's aggregate supply curve? (Click to select) v What effect would this shift of aggregate supply have on the price level and the level of real output? O The price level would decrease and real output would increase. O Both the price level and real output would remain the same. O The price level would decrease and real output would remain the same. O The price level would increase…arrow_forwardSuppose aggregate demand in the economy sharply decines. Keynesian economists say that the price level (at least for a time) will and real output wil O remain constant; decrease Increase; remain constant remain constant; increase decrease; remain constant lo000arrow_forwardWhich of the following changes in personal income tax would lead to the smallest increase in consumption? O a. O b. a $15 000 decrease in taxes, if MPC equals 0.6 O c. a $30 000 decrease in taxes, if MPC equals 0.25 Oe. a $20 000 decrease in taxes, if MPC equals 0.5 O d. a $12 000 decrease in taxes, if MPC equals 0.75 a $10 000 decrease in taxes, if MPC equals 0.2arrow_forward
- demanded equal, exceed, or fall short of quantity supplied? llowing L012.4 c. Suppose that buyers desire to purchase $200 billion of extra real output at each price level. Sketch in the new aggregate By what amount? demand curve as AD,. What are the new equilibriumsate Real GDP level and level of real output? 4. Suppose that the table presented below shows an economy's relationship between real output and the inputs needed to pro- 225 225 duce that output: LO12.4 225 Real GDP 225 Input Quantity 150.0 $400 in the t run? 112.5 300 75.0 200 ut per a. What is productivity in this economy? b. What is the per-unit cost of production if the price of each input unit is $2? c. Assume that the input price increases from $2 to $3 with no accompanying change in productivity. What is the new per- unit cost of production? In what direction would the $1 increase in input price push the economy's aggregate supply curve? What effect would this shift of aggregate supply have on the price level and the…arrow_forwardSuppose consumption function is specified as C= $200 + 0.75Ya planned investment is $600, net taxes are $400, and government spending totals $500 of a hypothetical economy in 2020. Find algebraically: LO 3 A. The equilibrium level of aggregate output by equating aggregate output and planned aggregate expenditure. B. Consumption when aggregate output is at the equilibrium level. C. Saving when aggregate output is at the equilibrium level. D. Establish that leakages equal injections at the equilibrium level of aggregate output.arrow_forwardWhich of the following both shift aggregate demand right? O A. net exports rise for some reason other than a price change and the money supply rises. O B. net exports rise for some reason other than a price change and the price level rises. O C. net exports fall for some reason other than a price change and the money supply rises. O D. net exports fall for some reason other than a price change and the price level rises.arrow_forward
- Suppose that consumer spending initially rises by $5 billion for every 1 percent rise in household wealth and that investment spending initially rises by $20 billion for every 1 percentage point fall in the real interest rate. Also assume that the economy�s multiplier is 3. If household wealth falls by 6 percent because of declining house values, and the real interest rate falls by 2 percentage points, in what direction and by how much will the aggregate demand curve initially shift at each price level? The aggregate demand curve will shift_____ by $____ billion. In what direction and by how much will it eventually shift? The aggregate demand curve will shift_____ by $____ billion..arrow_forwardAn economy has a recessionary gap. With no change in aggregate demand, how does the economy return to full employment? O A. The money wage rate rises, real GDP increases, and the price level falls. O B. The money wage rate falls, real GDP increases, and the price level rises. O C. The money wage rate falls, aggregate supply increases, and the price level falls. O D. The money wage rate rises, real GDP decreases, and the price level rises. -to ooloct vour answer.arrow_forwardIf the long-run aggregate supply curve is vertical, the a change in net taxes on aggregate output in the long run is zero. Select one: O a. additional tax revenue resulting from O b. multiplier effect of O c absolute value of Od. change in government spending based onarrow_forward
- 4. LO 4 In Figure 3.11, after the 1981-1982 reces- sion, does the price level appear to be procyclical, countercylical, or acyclical? Why is this important?arrow_forwardSuppose the economy is in long-run equilibrium. Then because of the COVID pandemic, people become worried about their future income and retain that worry for some time. How is the new long-run equilibrium different from the original one? O a. the price level is the same and GDP is lower. O b. both price and real GDP are higher. O c. the price level is lower and real GDP is the same. O d. both price and real GDP are lower.arrow_forward8. Suppose that aggregate demand and supply for a hypothetical economy are as shown: P Amount of real Price Amount rea AS GDP level GDP supplie demanded, billions (price index) billions 100 300 450 200 250 400 AD' 300 200 300 AD 400 150 200 500 100 100 Real 100 200 300 400 GDP Use these sets of data to graph the aggregate demand and aggregate supply curves. What is the equilibrium price level and the equilibrium level of real output in this hypothetical economy? Equilibrium price level = Is the equilibrium real output also necessarily the full-capacity real output? (Yes, No ) The full-capacity level of GDP is more lil cut at $ а. Equilibrium real output = $ billion billion. b. Why will a price level of 150 not be an equilibrium price level in this economy? Why not 250? billion, (more, less ) than billion. The (shortage, surplus) of real output will drive the At a price level of 150, real GDP supplied is a maximum of $ the real GDP demanded of $ price level up. At a price level of 250,…arrow_forward

 Principles of Economics (12th Edition)EconomicsISBN:9780134078779Author:Karl E. Case, Ray C. Fair, Sharon E. OsterPublisher:PEARSON
 Engineering Economy (17th Edition)EconomicsISBN:9780134870069Author:William G. Sullivan, Elin M. Wicks, C. Patrick KoellingPublisher:PEARSON
 Principles of Economics (MindTap Course List)EconomicsISBN:9781305585126Author:N. Gregory MankiwPublisher:Cengage Learning
 Managerial Economics: A Problem Solving ApproachEconomicsISBN:9781337106665Author:Luke M. Froeb, Brian T. McCann, Michael R. Ward, Mike ShorPublisher:Cengage Learning
 Managerial Economics & Business Strategy (Mcgraw-...EconomicsISBN:9781259290619Author:Michael Baye, Jeff PrincePublisher:McGraw-Hill Education