
Concept explainers
Videos
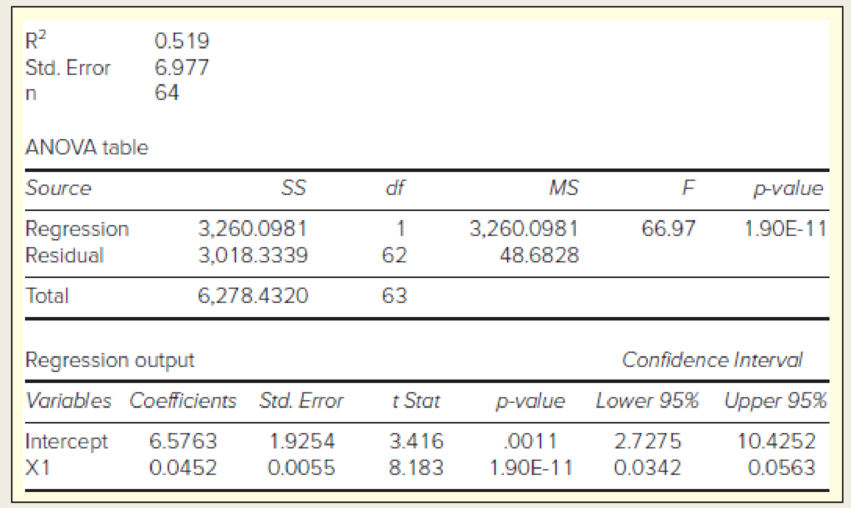
In the following regression, X = total assets ($ billions), Y = total revenue ($ billions), and n = 64 large banks. (a) Write the fitted regression equation. (b) State the degrees of freedom for a two-tailed test for zero slope, and use Appendix D to find the critical value at α = .05. (c) What is your conclusion about the slope? (d) Interpret the 95 percent confidence limits for the slope. (e) Verify that F= t2 for the slope. (f) In your own words, describe the fit of this regression.
a.
Write the fitted regression equation.
Answer to Problem 68CE
The regression equation is,
Explanation of Solution
Calculation:
An output of a regression is given. The X variable is the total assets and Y be the total revenue.
Regression:
Suppose
Where,
The total sum of squares is denoted as,
The regression sum of squares is denoted as,
The error sum of squares is denoted as,
From the regression the fitted line is denoted as,
From the output,
Hence, the regression equation is,
b.
Find the degrees of freedom for the two-tailed test for zero slope.
Find the critical value at 0.05 level of significanceusing Appendix D.
Answer to Problem 68CE
The degrees of freedom for the two-tailed test for zero slop is62.
The critical value at 0.05 level of significanceis 2.000.
Explanation of Solution
Calculation:
Critical value:
Here from the output, the sample size,
The degrees of freedom is,
For two tailed test, the critical value for t-test will be,
From the Appendix D: STUDENT’S t CRITICAL VALUES:
- • Since 62 is not in the table, so locate the value 60in the column of degrees of freedom.
- • Locate the 0.025 in level of significance.
- • The intersecting value that corresponds to the degrees of freedom 60 with level of significance 0.025 is 2.000.
Thus, the critical-valueusing Appendix D is 2.000.
c.
Make a conclusion about the slope.
Explanation of Solution
Let
Hypotheses:
Null hypothesis:
That is, the slope is zero.
Alternative hypothesis:
That is, the slope is not equal to zero.
Decision rule:
If
If
From the output, the t-statistics is 8.183 and from part (b), the critical value at 0.05 level of significanceis 2.000.
Conclusion:
Here the t-statistics is greater than the critical value at 0.05 level of significance.
That is,
Hence, by the decision rule reject the null hypothesis.
That is, the slope is significantly different from zero.
d.
Interpret the 95% confidence interval for the slope.
Explanation of Solution
The 95% confidence interval for the slope,
Where,
From the output, the 95% confidence interval of the slope is (0.0342, 0.0563).
Interpretation:
From the confidence interval it can be concluded that there is 95% confident that the slope will lie between 0.0342 and 0.0563.
e.
Verify
Explanation of Solution
Calculation:
From the output the F statistic is 66.97.
For the slope the t-statistic is 8.183.
Hence, it can be concluded that
f.
Describe the fit of the regression.
Explanation of Solution
Calculation:
From the output, the R-squared value is 0.519.
The coefficient of determination (
The
Want to see more full solutions like this?
Chapter 12 Solutions
APPLIED STAT.IN BUS.+ECONOMICS


- For the following exercises, use Table 4 which shows the percent of unemployed persons 25 years or older who are college graduates in a particular city, by year. Based on the set of data given in Table 5, calculate the regression line using a calculator or other technology tool, and determine the correlation coefficient. Round to three decimal places of accuracyarrow_forwardFor the following exercises, consider the data in Table 5, which shows the percent of unemployed in a city ofpeople25 years or older who are college graduates is given below, by year. 41. Based on the set of data given in Table 7, calculatethe regression line using a calculator or othertechnology tool, and determine the correlationcoefficient to three decimal places.arrow_forwardFor the following exercises, consider the data in Table 5, which shows the percent of unemployed ina city of people 25 years or older who are college graduates is given below, by year. 40. Based on the set of data given in Table 6, calculate the regression line using a calculator or other technology tool, and determine the correlation coefficient to three decimal places.arrow_forward
- Respiratory Rate Researchers have found that the 95 th percentile the value at which 95% of the data are at or below for respiratory rates in breath per minute during the first 3 years of infancy are given by y=101.82411-0.0125995x+0.00013401x2 for awake infants and y=101.72858-0.0139928x+0.00017646x2 for sleeping infants, where x is the age in months. Source: Pediatrics. a. What is the domain for each function? b. For each respiratory rate, is the rate decreasing or increasing over the first 3 years of life? Hint: Is the graph of the quadratic in the exponent opening upward or downward? Where is the vertex? c. Verify your answer to part b using a graphing calculator. d. For a 1- year-old infant in the 95 th percentile, how much higher is the walking respiratory rate then the sleeping respiratory rate? e. f.arrow_forwardLife Expectancy The following table shows the average life expectancy, in years, of a child born in the given year42 Life expectancy 2005 77.6 2007 78.1 2009 78.5 2011 78.7 2013 78.8 a. Find the equation of the regression line, and explain the meaning of its slope. b. Plot the data points and the regression line. c. Explain in practical terms the meaning of the slope of the regression line. d. Based on the trend of the regression line, what do you predict as the life expectancy of a child born in 2019? e. Based on the trend of the regression line, what do you predict as the life expectancy of a child born in 1580?2300arrow_forwardDoes Table 1 represent a linear function? If so, finda linear equation that models the data.arrow_forward
- For the following exercises, use Table 4 which shows the percent of unemployed persons 25 years or older who are college graduates in a particular city, by year. Determine whether the trend appears linear. If so, and assuming the trend continues, find a linear regression model to predict the percent of unemployed in a given year to three decimal places.arrow_forwardWhat is regression analysis? Describe the process of performing regression analysis on a graphing utility.arrow_forwardA regression between foot length (response variable in cm) and height (explanatory variable in inches) for 42 students resulted in the following regression equation: y = 10.4 + 0.21x If a student happened to be extraordinarily tall (say, 10ft, just for the fun of it) and had a foot size of 25 cm, how might this affect the slope of the regression line?arrow_forward
- b. Find the equation of regression line between radiation doses on exposure time .usingleast square method.arrow_forwardThe age and height (in cm) of 400 adult women from Bolivia were measured. A researcher wants to know if age has any effect on height. A linear regression is carried out in Minitab and the following output obtained. Coefficients Term Constant Age (a) Write down the regression model. (b) Interpret the regression coefficient for the fitted model. (c) Use the output from Minitab to explain if the age of a participant affects their height. Percent (d) The normal probability plot of the residuals from this regression model is given below. Do the assumptions of the regression model seem reasonable? Justify your answer. 99.9 8 28 22299229 88 Coef SE Coef 152.94 7.69 0.022 0.231 01 -100 T-Value P-Value VIF 19.90 0.000 0.10 0.924 1.00 -50 Normal Probability Plot (response is Height) 0 Residual 50 ***** 100 150arrow_forwardIncrease in sales (percent) An advertising firm wishes to demonstrate to its clients the effectiveness of the advertising campaigns it has conducted. The following bivariate data on twelve recent campaigns, including the cost of each campaign (in millions of dollars) and the resulting percentage increase in sales following the campaign, were presented by the firm. Based on these data, we would compute the least-squares regression line to be y = 6.16+0.18x, with x representing campaign cost and y representing the resulting percentage increase in sales. (This line is shown below, along with a scatter plot of the data.) Increase in sales, y Campaign cost, x (in millions of dollars) (percent) 3.02 6.91 7.2+ 1.92 6.80 3.83 6.85 6.8- 1.40 6.37 6.6 - 3.12 6.42 3.56 6.82 6.4- 4.06 6.94 6.2 1.64 6.56 6- 2.06 6.50 1.62 6.18 1.5 2.5 3.5 6.66 Campaign cost (in millions of dollars) 2.87 2.25 6.61 Send data to calculator Based on the firm's data and the regression line, complete the following. (a)…arrow_forward

 Glencoe Algebra 1, Student Edition, 9780079039897...AlgebraISBN:9780079039897Author:CarterPublisher:McGraw Hill
 Calculus For The Life SciencesCalculusISBN:9780321964038Author:GREENWELL, Raymond N., RITCHEY, Nathan P., Lial, Margaret L.Publisher:Pearson Addison Wesley,
 Functions and Change: A Modeling Approach to Coll...AlgebraISBN:9781337111348Author:Bruce Crauder, Benny Evans, Alan NoellPublisher:Cengage Learning
 Algebra & Trigonometry with Analytic GeometryAlgebraISBN:9781133382119Author:SwokowskiPublisher:Cengage
 Algebra and Trigonometry (MindTap Course List)AlgebraISBN:9781305071742Author:James Stewart, Lothar Redlin, Saleem WatsonPublisher:Cengage Learning