
Concept explainers
Videos
Using Probability Distributions [LO3] Suppose the returns on long-term corporate bonds and T-bills are
a. What is the probability that in any given year, the return on long-term corporate bonds will be greater than 10 percent? Less than 0 percent?
b. What is the probability that in any given year, the return on T-bills will be greater than 10 percent? Less than 0 percent?
c. In 1979, the return on long-term corporate bonds was −2.76 percent. How likely is it that such a low return will recur at some point in the future? T-bills had a return of 10.56 percent in this same year. How likely is it that such a high return on T-bills will recur at some point in the future?
a)
To determine: The probability of earning more than 10 percent on long-term corporate bonds.
Introduction:
The Normal distribution curve is a bell-shaped curve formed based on the frequency distribution of the observations The mean or average of the observations and their standard deviation define the normal distribution curve.
Standard deviation refers to the variation in the actual observations from the average. Z-Score helps to know how many numbers of standard deviations is the raw score or outcome away from the average or mean.
Answer to Problem 24QP
The probability of earning more than 10 percent on long-term corporate bonds is 32.98 percent.
Explanation of Solution
Given information:
Assume that the returns of long-term corporate bonds have a normal distribution. The average return or mean of long-term corporate bonds is 6.3 percent, and the standard deviation is 8.4 percent (Refer to Figure 12.10 in the text).
Determine the probability of having a return greater than 10 percent on long-term government bonds:
Follow the common steps from Step 1 to Step 3 given below. Next, proceed with the Step 4.
The common steps to be followed to use the “NORM.DIST” function in Excel:
Step 1:
Open an Excel worksheet.
Step 2:
Place the cursor in cell A1.

Step 3:
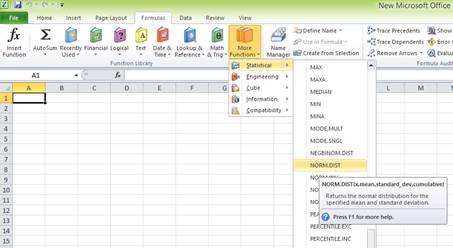
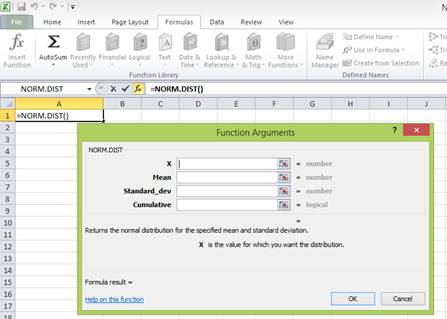
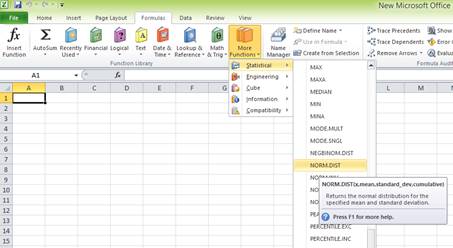
Select the “Formulas” tab, and go to “More functions” in the ribbon. Under “More functions”, select “Statistical”. Under the drop-down menu of “Statistical”, select “NORM.DIST” function.

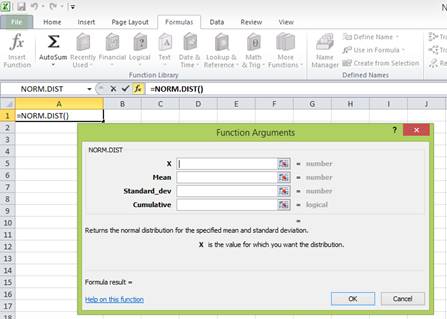
After clicking the “NORM.DIST” function, a popup window named “Function arguments” appears.
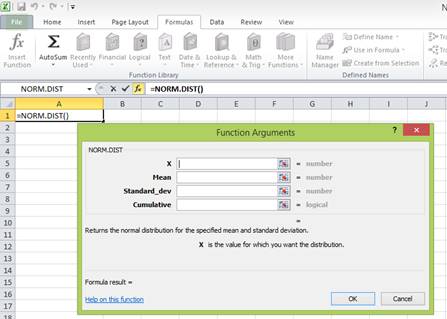
Step 4:
Enter the values. “X” represents the raw score or outcome. Here, it is necessary to test the probability of having more than 10 percent returns. Hence, “X” equals 10 percent. The mean or average return is 6.3 percent. The standard deviation is 8.4 percent. The cumulative distribution function provides the probability of the area to the left of Z. Hence, enter “TRUE” in the “Cumulative” column.
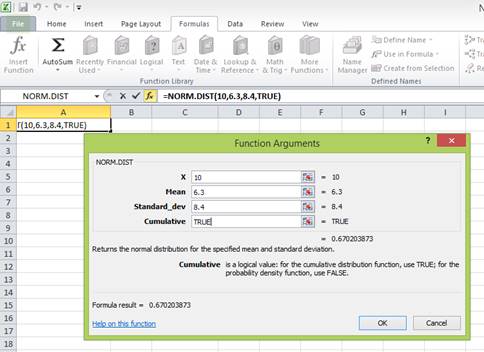
Press “OK” after providing the inputs. The probability of the area to the left of Z is as follows:
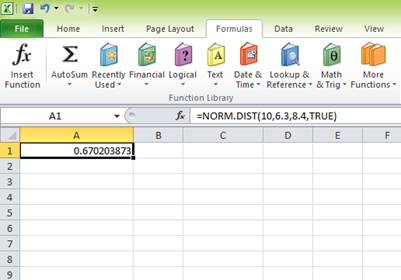
The probability of 0.670203873 represents the area to the left of Z. The area to the left of Z is the probability of getting less than 10 percent return. The area to the right of Z is the probability of getting a return of 10 percent or more.
The total area represented by the normal distribution curve has a probability of “1”. The area to the left of Z has a probability of 0.670203873. Hence, the probability of the area to the right of Z is “1” minus the probability of the area to the left of Z. Hence, the probability of getting 10 percent return or more is 0.329796127 or 32.98 percent
To determine: The probability of earning less than 0 percent on long-term corporate bonds.
Answer to Problem 24QP
The probability of earning less than 0 percent on long-term corporate bonds is 0.226627352 or 22.66 percent.
Explanation of Solution
Given information:
Assume that the returns of long-term corporate bonds have a normal distribution. The average return or mean of long-term corporate bonds is 6.3 percent, and the standard deviation is 8.4 percent (Refer to Figure 12.10 in the text).
Determine the probability of having a return less than 0 percent on long-term government bonds:
Follow the common steps from Step 1 to Step 3 given below. Next, proceed with the Step 4.
The common steps to be followed to use the “NORM.DIST” function in Excel:
Step 1:
Open an Excel worksheet.
Step 2:
Place the cursor in cell A1.

Step 3:
Select the “Formulas” tab, and go to “More functions” in the ribbon. Under “More functions”, select “Statistical”. Under the drop-down menu of “Statistical”, select “NORM.DIST” function.
After clicking the “NORM.DIST” function, a popup window named “Function arguments” appears.

Step 4:
Enter the values. “X” represents the raw score or outcome. Here, it is necessary to test the probability of having (0 percent) return or less. Hence, “X” equals (0 percent). The mean or average return is 6.3 percent. The standard deviation is 8.4 percent. The cumulative distribution function provides the probability of the area to the left of Z. Hence, enter “TRUE” in the “Cumulative” column.
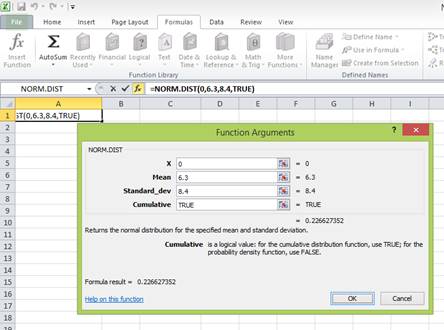
Press “OK” after providing the inputs. The probability of the area to the left of Z is as follows:
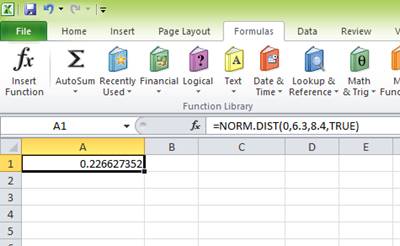
The probability of 0.226627352 represents the area to the left of Z. The area to the left of Z refers to the probability of getting (0 percent) return or less because the left-hand side of the normal distribution curve indicates negative returns. Hence, the probability of earning less than 0 percent is 0.226627352 or 22.66 percent.
b)
To determine: The probability of earning more than 10 percent on Treasury bills.
Answer to Problem 24QP
The probability of earning more than 10 percent on Treasury bills is 0.018006785 or 1.80 percent.
Explanation of Solution
Given information:
Assume that the returns of Treasury bills have a normal distribution. The average return or mean of Treasury bills is 3.5 percent, and the standard deviation is 3.1 percent (Refer to Figure 12.10 in the text).
Determine the probability of having a return greater than 10 percent on Treasury bills:
Follow the common steps from Step 1 to Step 3 given below. Next, proceed with the Step 4.
The common steps to be followed to use the “NORM.DIST” function in Excel:
Step 1:
Open an Excel worksheet.
Step 2:
Place the cursor in cell A1.

Step 3:
Select the “Formulas” tab, and go to “More functions” in the ribbon. Under “More functions”, select “Statistical”. Under the drop-down menu of “Statistical”, select “NORM.DIST” function.
After clicking the “NORM.DIST” function, a popup window named “Function arguments” appears.
Step 4:
Enter the values. “X” represents the raw score or outcome. Here, it is necessary to test the probability of having more than 10 percent returns. Hence, “X” equals 10 percent. The mean or average return is 3.5 percent. The standard deviation is 3.1 percent. The cumulative distribution function provides the probability of the area to the left of Z. Hence, enter “TRUE” in the “Cumulative” column.
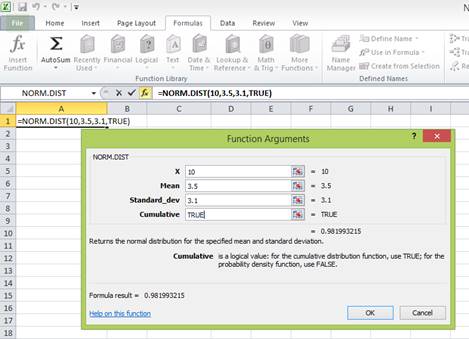
Press “OK” after providing the inputs. The probability of the area to the left of Z is as follows:
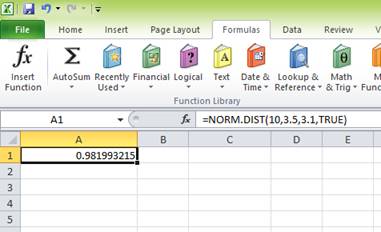
The probability of 0.981993215 represents the area to the left of Z. The area to the left of Z is the probability of getting less than 10 percent return. The area to the right of Z is the probability of getting a return of 10 percent or more.
The total area represented by the normal distribution curve has a probability of “1”. The area to the left of Z has a probability of 0.981993215. Hence, the probability of the area to the right of Z is “1” minus the probability of the area to the left of Z. Hence, the probability of getting 10 percent return or more is 0.018006785 or 1.80 percent
To determine: The probability of earning less than 0 percent on Treasury bills.
Answer to Problem 24QP
The probability of earning less than 0 percent on Treasury bills is 0.129442113 or 12.94 percent.
Explanation of Solution
Given information:
Assume that the returns of Treasury bills have a normal distribution. The average return or mean of Treasury bills is 3.5 percent, and the standard deviation is 3.1 percent (Refer to Figure 12.10 in the text).
Determine the probability of having a return less than 0 percent on Treasury bills:
Follow the common steps from Step 1 to Step 3 given below. Next, proceed with the Step 4.
The common steps to be followed to use the “NORM.DIST” function in Excel:
Step 1:
Open an Excel worksheet.
Step 2:
Place the cursor in cell A1.

Step 3:
Select the “Formulas” tab, and go to “More functions” in the ribbon. Under “More functions”, select “Statistical”. Under the drop-down menu of “Statistical”, select “NORM.DIST” function.
After clicking the “NORM.DIST” function, a popup window named “Function arguments” appears.
Step 4:
Enter the values. “X” represents the raw score or outcome. Here, it is necessary to test the probability of having (0 percent) return or less. Hence, “X” equals (0 percent). The mean or average return is 3.5 percent. The standard deviation is 3.1 percent. The cumulative distribution function provides the probability of the area to the left of Z. Hence, enter “TRUE” in the “Cumulative” column.
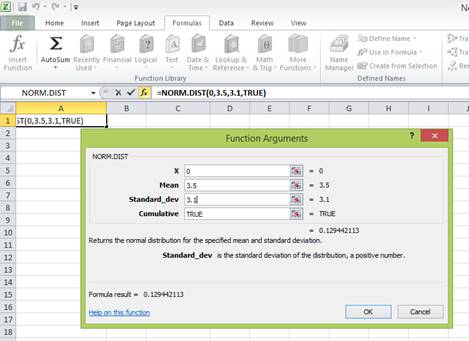
Press “OK” after providing the inputs. The probability of the area to the left of Z is as follows:
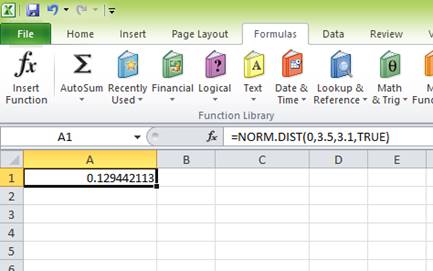
The probability of 0.129442113 represents the area to the left of Z. The area to the left of Z refers to the probability of getting (0 percent) return or less because the left-hand side of the normal distribution curve indicates negative returns. Hence, the probability of earning less than 0 percent is 0.129442113 or 12.94 percent.
c)
To determine: The probability of earning (2.76 percent) on long-term corporate bonds.
Answer to Problem 24QP
The probability of earning (2.76 percent) on long-term corporate bonds is 0.140389412 or 14.04 percent.
Explanation of Solution
Given information:
Assume that the returns of long-term corporate bonds have a normal distribution. The average return or mean of long-term corporate bonds is 6.3 percent, and the standard deviation is 8.4 percent (Refer to Figure 12.10 in the text).
Determine the probability of having (2.76 percent) on long-term government bonds:
Follow the common steps from Step 1 to Step 3 given below. Next, proceed with the Step 4.
The common steps to be followed to use the “NORM.DIST” function in Excel:
Step 1:
Open an Excel worksheet.
Step 2:
Place the cursor in cell A1.
Step 3:
Select the “Formulas” tab, and go to “More functions” in the ribbon. Under “More functions”, select “Statistical”. Under the drop-down menu of “Statistical”, select “NORM.DIST” function.
After clicking the “NORM.DIST” function, a popup window named “Function arguments” appears.
Step 4:
Enter the values. “X” represents the raw score or outcome. Here, it is necessary to test the probability of having (2.76 percent) return or less. Hence, “X” equals (2.76 percent). The mean or average return is 6.3 percent. The standard deviation is 8.4 percent. The cumulative distribution function provides the probability of the area to the left of Z. Hence, enter “TRUE” in the “Cumulative” column.
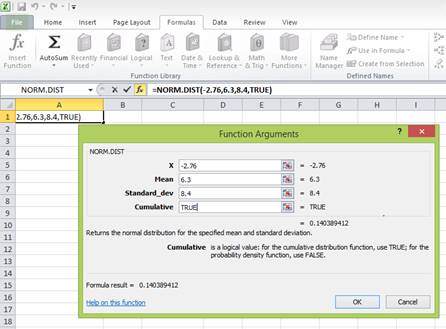
Press “OK” after providing the inputs. The probability of the area to the left of Z is as follows:
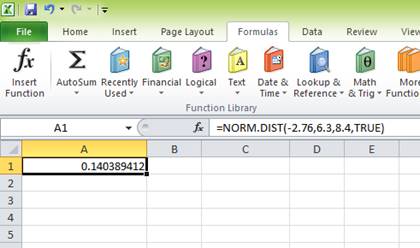
The probability of 0.140389412 represents the area to the left of Z. The area to the left of Z refers to the probability of getting (2.76 percent) return or less because the left-hand side of the normal distribution curve indicates negative returns. Hence, the probability of earning (2.76 percent) is 0.140389412 or 14.04 percent.
To determine: The probability of earning 10.56 percent on Treasury bills.
Answer to Problem 24QP
The probability of earning 10.56 percent on Treasury bills is 0.011380598 or 1.14 percent.
Explanation of Solution
Given information:
Assume that the returns of Treasury bills have a normal distribution. The average return or mean of Treasury bills is 3.5 percent, and the standard deviation is 3.1 percent (Refer to Figure 12.10 in the text).
Determine the probability of having a return of 10.56 percent on Treasury bills:
Follow the common steps from Step 1 to Step 3 given below. Next, proceed with the Step 4.
The common steps to be followed to use the “NORM.DIST” function in Excel:
Step 1:
Open an Excel worksheet.
Step 2:
Place the cursor in cell A1.

Step 3:
Select the “Formulas” tab, and go to “More functions” in the ribbon. Under “More functions”, select “Statistical”. Under the drop-down menu of “Statistical”, select “NORM.DIST” function.
After clicking the “NORM.DIST” function, a popup window named “Function arguments” appears.
Step 4:
Enter the values. “X” represents the raw score or outcome. Here, it is necessary to test the probability of having 10.56 percent returns. Hence, “X” equals 10.56 percent. The mean or average return is 3.5 percent. The standard deviation is 3.1 percent. The cumulative distribution function provides the probability of the area to the left of Z. Hence, enter “TRUE” in the “Cumulative” column.
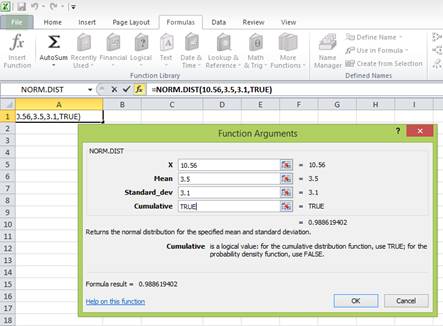
Press “OK” after providing the inputs. The probability of the area to the left of Z is as follows:

The probability of 0.988619402 represents the area to the left of Z. The area to the left of Z is the probability of getting less than 10.56 percent return. The area to the right of Z is the probability of getting a return of 10.56 percent or more.
The total area represented by the normal distribution curve has a probability of “1”. The area to the left of Z has a probability of 0.988619402. Hence, the probability of the area to the right of Z is “1” minus the probability of the area to the left of Z. Hence, the probability of getting 10.56 percent return or more is 0.011380598 or 1.14 percent
Want to see more full solutions like this?
Chapter 12 Solutions
Fundamentals of Corporate Finance


- 10. Suppose that interest rates decrease. Assuming all other parameters that impact the price of bonds and stocksremain constant, what would you expect to happen to bond and stock prices?a. Bond prices would increase and stock prices would decrease.b. Bond prices would decrease and stock prices would decrease.c. Bond prices would decrease and stock prices would increase.d. Bond prices would increase and stock prices would increase.e. Stock prices would increase. More information would be needed to determine the impact on bond prices. 11. Which of the following bonds would have the smallest change in price (in percentage terms) for a givenchange in interest rates (i.e., yield to maturity) – that is, if the yield to maturity on a bond increases from 8%to 10%, all else constant, which of the following bond prices will change the least (in percentage terms)?a. A $1000 par value bond with a 10% coupon rate (annual payments) that matures in 2 years.b. A $1000 par value bond with a 10%…arrow_forwardYou have been given this probability distribution for the Expected Return of Stock and Bond Status of economy Probability rate of Stock return Bond return return 0.25 0.5 0.30 Recession Normal growth Boom -4.5% 5% 15% (iv) What is the expected rate of return of stock and bonds? (v) Compute the standard deviation of stock and bonds returns? (vi) Compute the coefficient of variation? -2% 4% 7% (vii) If an investor allocates 60% of asset to stock and remaining to bond, what would be the investor's portfolio returns and standard deviation? (viii) Is there any diversification benefit achieved?arrow_forwardIf d1 = 1.25, g (which is constant) = 4.7%, and Po = $26, what is the expected dividend yield for the coming year? Bond valuation related problems should be solved by using a financial calculator or MS excel spreadsheet. Accordingly, you must show the values of all relevant time valu of money variablesarrow_forward
- You are comparing Stock A to Stock B. Given the following information, what is the difference in the expected returns of these two securities? State of Economy Probability of State of Economy Rate of Return if State Occurs Stock A Stock B Normal .75 .13 .16 Recession .25 −.05 −.21arrow_forwardConsider the following scenario analysis: Rate of Return Stocks Scenario Bonds Probability 0.20 Recession -6% 18% Normal economy 0.50 19% 11% Boom 0.30 26% 8% a. Is it reasonable to assume that Treasury bonds will provide higher returns in recessions than in booms? O No Ⓒ Yes b. Calculate the expected rate of return and standard deviation for each investment. (Do not round intermediate calculations. Enter your answers as a percent rounded to 1 decimal place.) Expected Rate of Standard Deviation Return Stocks 16.1 % % Bonds 9.7 % % c. Which investment would you prefer? Bond Which investment would you prefer? Stockarrow_forwardConsider the following scenario analysis: Rate of Return Scenario Probability Stocks Bonds Recession 0.20 −4 % 16 % Normal economy 0.50 18 % 9 % Boom 0.30 29 % 6 % a. Is it reasonable to assume that Treasury bonds will provide higher returns in recessions than in booms? Yes or No b. Calculate the expected rate of return and standard deviation for each investment. (Do not round intermediate calculations. Enter your answers as a percent rounded to 1 decimal place.) Expected Rate of Return Standard deviation Stock Bond c. Which investment would you prefer?arrow_forward
- Consider the following scenario analysis: RATE OF RETURN Stocks &Bonds Scenario Probability Stocks Bonds Recession 0.20 −9% 21% Normal economy 0.70 22 9% Boom 0.10 25 5% a. Is it reasonable to assume that Treasury bonds will provide higher returns in recessions than in booms? Yes or No b. Calculate the expected rate of return and standard deviation for each investment. (Do not round intermediate calculations. Enter your answers as a percent rounded to 1 decimal place.) Expected Rate of Return Standard Deviation Stocks % % Bonds % %arrow_forwardFinance Consider the following statements I. A drop in the price-dividend ratio predicts a significantly higher excess return on the market over the next 5 years An increase in the yield-to-maturity spread between BAA and AAA rated bonds predicts a significantly higher excess return on the market over the next year I. The price-to-earning ratio is a better predictor for future market excess returns in short horizons than long horizons I. IV. Gold-to-platinum is a better predictor for the next month market excess return than the variance risk premium Which statements are correct?arrow_forwardConsider the following scenario analysis: Scenario Probability Stocks Bonds Recession 0.30 -6 % +15% Normal Economy 0.30 +14 + 7 Boom 0.40 +26 +5 Calculate the expected rate of return and standard deviation for each investment? Which investment would you prefer?arrow_forward
- 1. (Without loss of generality assume that the expected/maximal exposures mentioned here correspond to a single time point in future, T.) Bank A uses for economic capital (EC) a measure equal to: 1.4 * EPE. Bank B, instead, uses the weighted average: 70% * EPE + 30% * ME. How small (or, indeed, how big?) does the ME (maximal exposure) need to be, relative to the EPE, for Bank A to end up putting aside (for this specific EC aspect) more EC than Bank B?arrow_forwardⓇ Suppose the returns on a particular asset are normally distributed. Also suppose the asset had an average return of 11.1% and a standard deviation of 23.4%. Use the NORMDIST function in Excel to determine the probability that in any given year you will lose money by investing in this asset. (Do not round intermediate calculations and enter your answer as a percent rounded to 2 decimal places, e.g., 32.16.): Probability %arrow_forwardConsider the following scenario analysis: Rate of Return Scenario Probability Stocks Bonds Recession 0.20 -4% 19% Normal economy 0.40 20% 9% Boom 0.40 26% 8% a. Is it reasonable to assume that Treasury bonds will provide higher returns in recessions than in booms? O No O Yes b. Calculate the expected rate of return and standard deviation for each investment. (Do not round intermediate calculations. Enter your answers as a percent rounded to 1 decimal place.) Expected Rate of Return Standard Deviation Stocks % % Bonds % c. Which investment would you prefer? Stock Bond Which investment would you prefer?arrow_forward

 EBK CONTEMPORARY FINANCIAL MANAGEMENTFinanceISBN:9781337514835Author:MOYERPublisher:CENGAGE LEARNING - CONSIGNMENT