
Videos
Incidence of breast cancer. The following graph (considered in Exercise 28 of Exercise Set R.1 without an equation) approximates the incidence of breast cancer I, per 100,000 women, as a function of age x. The equation for this graph is
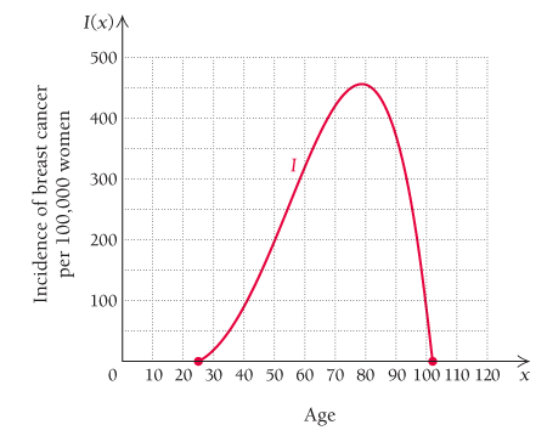
(Source: Based on data from the National Cancer Institute)
a. Use the graph to determine the domain of I.
b. Use the graph to determine the range of I.
c. What 10-yr age interval sees the greatest increase in the incidence of breast cancer? Explain how you determined this.
d. Approximately
Want to see the full answer?
Check out a sample textbook solution
Chapter R Solutions
Calculus and Its Applications (11th Edition)
Additional Math Textbook Solutions
University Calculus: Early Transcendentals (4th Edition)
Precalculus
Precalculus (10th Edition)
Calculus & Its Applications (14th Edition)
Calculus: Early Transcendentals (3rd Edition)


 Algebra & Trigonometry with Analytic GeometryAlgebraISBN:9781133382119Author:SwokowskiPublisher:Cengage