Videos
America is getting older. The graph shows the projected elderly U.S. population for ages 65-84 and for ages 85 and older.
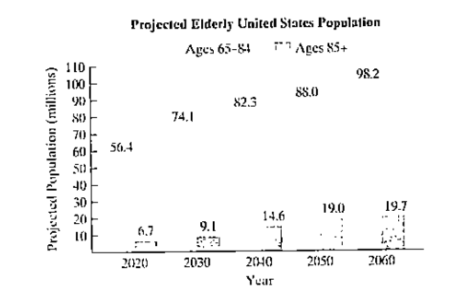
Source: U.S. Census Bureau
The formula
a. Use the formula to find the projected increase in the number of Americans ages 65-84. in millions, from 2030 to 2060. Express this difference in simplified radical form.
b. Use a calculator and write your answer in part (a) to the nearest tenth. Does this rounded decimal overestimate or underestimate the difference in the projected data shown by the bar graph on the previous page? By how much?
Want to see the full answer?
Check out a sample textbook solution
Chapter P Solutions
College Algebra (7th Edition)
Additional Math Textbook Solutions
Elementary Algebra
Algebra And Trigonometry (11th Edition)
Introductory Algebra for College Students (7th Edition)
Algebra: Structure And Method, Book 1
A Graphical Approach to College Algebra (6th Edition)


- Explain why the values of an increasing exponentialfunction will eventually overtake the valuesof anincreasing linear function.arrow_forwardHeart Disease In a certain country, the number of deaths due to heart disease decreased from 235 in one year to 221 in the next year. What percentage decrease in deaths due to heart disease does this represent?arrow_forwardDoes a linear, exponential, or logarithmic model best fit the data in Table 2? Find the model.arrow_forward

 College Algebra (MindTap Course List)AlgebraISBN:9781305652231Author:R. David Gustafson, Jeff HughesPublisher:Cengage Learning
 Functions and Change: A Modeling Approach to Coll...AlgebraISBN:9781337111348Author:Bruce Crauder, Benny Evans, Alan NoellPublisher:Cengage Learning
 Glencoe Algebra 1, Student Edition, 9780079039897...AlgebraISBN:9780079039897Author:CarterPublisher:McGraw Hill
 Big Ideas Math A Bridge To Success Algebra 1: Stu...AlgebraISBN:9781680331141Author:HOUGHTON MIFFLIN HARCOURTPublisher:Houghton Mifflin Harcourt