Videos
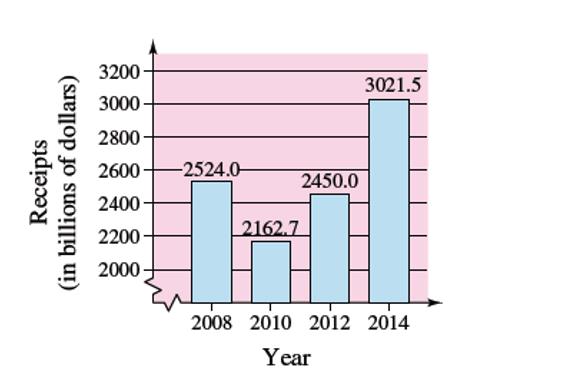
In Exercises 49-52, use the bar graph, which shows the receipts of the federal government (in billions of dollars) for selected years from

Want to see the full answer?
Check out a sample textbook solution
Chapter P Solutions
Trigonometry (MindTap Course List)


- In Exercises 49-52, use the bar graph, which shows the receipts of the federal government (in billions of dollars) for selected years from 2008 through 2014. In each exercise, you are given the expenditures of the federal government. Find the magnitude of the surplus or deficit for the year. YearReceipts,RExpenditures,ERE2008$2982.5billionarrow_forwardIn Exercises 49-52, use the bar graph, which shows the receipts of the federal government (in billions of dollars) for selected years from 2008 through 2014. In each exercise, you are given the expenditures of the federal government. Find the magnitude of the surplus or deficit for the year. YearReceipts,RExpenditures,ERE2012$3537.0billo 20123537.0billionarrow_forwardHeart Disease In a certain country, the number of deaths due to heart disease decreased from 235 in one year to 221 in the next year. What percentage decrease in deaths due to heart disease does this represent?arrow_forward
 Trigonometry (MindTap Course List)TrigonometryISBN:9781337278461Author:Ron LarsonPublisher:Cengage Learning
 Functions and Change: A Modeling Approach to Coll...AlgebraISBN:9781337111348Author:Bruce Crauder, Benny Evans, Alan NoellPublisher:Cengage Learning
 Holt Mcdougal Larson Pre-algebra: Student Edition...AlgebraISBN:9780547587776Author:HOLT MCDOUGALPublisher:HOLT MCDOUGAL
 Glencoe Algebra 1, Student Edition, 9780079039897...AlgebraISBN:9780079039897Author:CarterPublisher:McGraw Hill
 Elementary AlgebraAlgebraISBN:9780998625713Author:Lynn Marecek, MaryAnne Anthony-SmithPublisher:OpenStax - Rice University