Concept explainers
Videos
The graph below, called a
From the graph, it appears that the data follow a linear relation.
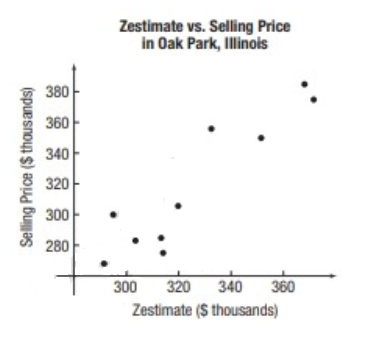
Imagine drawing a line through the data that appears to fit the data well. Do you believe the slope of the line would be positive, negative, or close to zero? Why?
The slope of the line would be positive, negative, or close to zero with reason, by imagine drawing a line through the data that appears to fit the data well.
Answer to Problem 1CP
Solution:
The line passing through the points on scatter plot is slant upward, so the slope of the line would be positive.
Explanation of Solution
Given information:
The data below show the “zestimate”-the selling price of a home as predicted by the folks at Zillow and the actual selling price of the home, for the home in Oak Park Illinois.
The graph below, called a scatter diagram, shows the points

Explanation:
It is observed that, line passing through the points on scatter plot is slant upward.
It is known that, when the slope of the line is positive, the line slants upward.
When the slope of the line is negative, the line slants downward.
When the slope of the line is zero, the line is horizontal.
When the slope of the line is undefined, the line is vertical.
The line passing through the points on scatter plot is slant upward, so the slope of the line would be positive.
Want to see more full solutions like this?
Chapter F Solutions
Precalculus: Concepts Through Functions, A Unit Circle Approach to Trigonometry (4th Edition)


- #2. Thanks. 11.2arrow_forwardThe profit (P) realized by a company varies directly as the number of products it sells (s). If a company makes a profit of $2850 on the sale of 150 products, what is the profit when the company sells 1500 products? O A. $285,000 O B. $78,000 O C. $36,500 O D. $29,750 O E. $28,500arrow_forwardplease help , it would be appreciated , thank youarrow_forward
- Plz explain asap.. tysmarrow_forwardA. $231.58 B. $213.85 C. $312.85 D. $211.50arrow_forwardCa.. Iverage number of children born per family. Number of children born per family Number of families Number of children born per family Number of families 0. 20 96 11 108 8. 2 6. 154 9. 3 126 10 4 95 11 62 12 6 45 13arrow_forward
 Algebra: Structure And Method, Book 1AlgebraISBN:9780395977224Author:Richard G. Brown, Mary P. Dolciani, Robert H. Sorgenfrey, William L. ColePublisher:McDougal Littell
 Functions and Change: A Modeling Approach to Coll...AlgebraISBN:9781337111348Author:Bruce Crauder, Benny Evans, Alan NoellPublisher:Cengage Learning
 Calculus For The Life SciencesCalculusISBN:9780321964038Author:GREENWELL, Raymond N., RITCHEY, Nathan P., Lial, Margaret L.Publisher:Pearson Addison Wesley,