
Concept explainers
Videos
(a)
To show: The inequality
(a)
Explanation of Solution
Definition used:
The natural logarithmic function is the function defined by
If
Calculation:
The given inequality is
Here,
By using the above mentioned definition,
Use online graphing calculator, graph of the curve
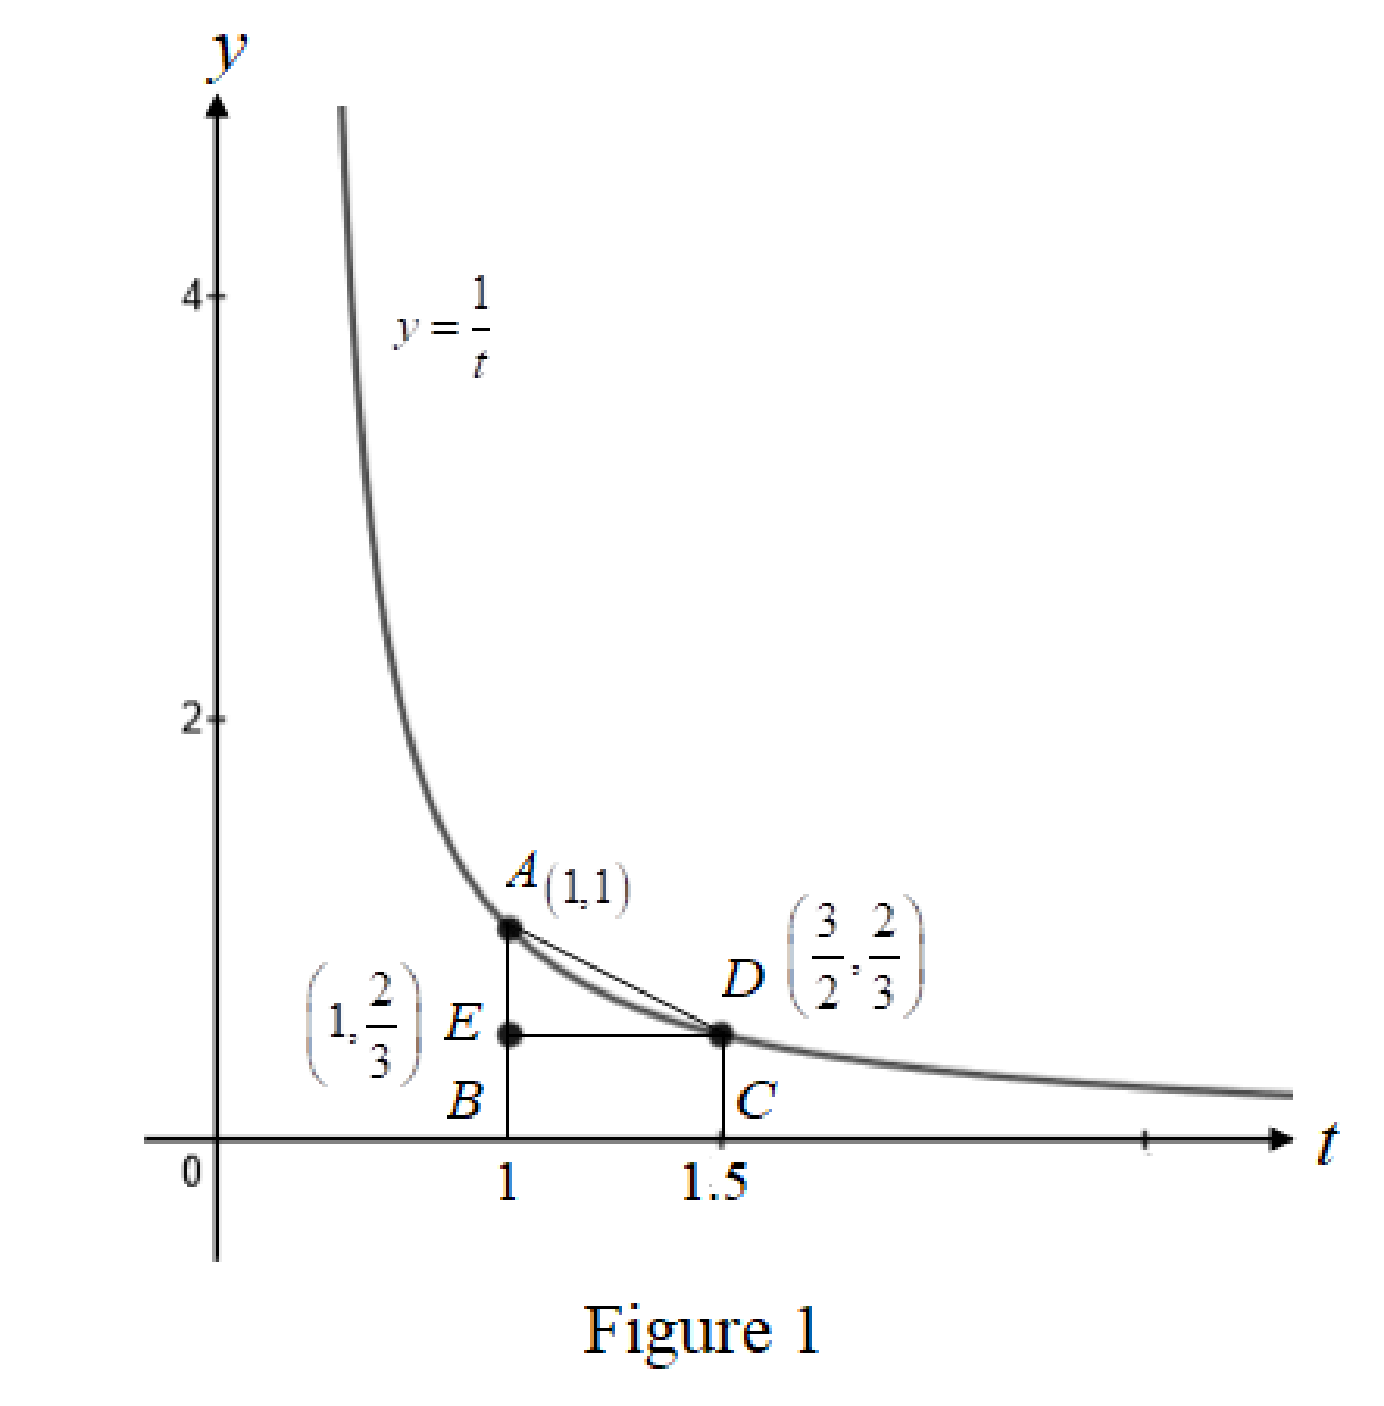
From Figure 1, it is observed that the area is larger than the area of rectangle BCDE and smaller than the area of trapezoid ABCD.
The area of the rectangle BCDE is calculated as follows.
The area of the trapezoid ABCD is calculated as follows.
It is known that the value of
The decimal value of the fraction
By comparing the above values with
Hence proved.
(b)
To show: The function
(b)
Answer to Problem 1E
The estimated value of
Explanation of Solution
Definition used:
Midpoint Rule:
Midpoint rule can be defined as
Where,
Natural logarithmic:
The natural logarithmic function is the function defined by
Calculation:
It is known that the equation of the curve is
Here,
From definition of natural logarithmic, the function
Here,
Find
Estimate the value of
Further simplification,
Therefore, the estimated value of
Want to see more full solutions like this?
Chapter C Solutions
Essential Calculus: Early Transcendentals


- Find the average rates of change of f(x)=x2+2x (a) from x1=3 to x2=2 and (b) from x1=2 to x2=0.arrow_forwardFind the average rate of change for each function over the given interval. y=x between x=1 and x=4arrow_forwardRespiratory Rate Researchers have found that the 95 th percentile the value at which 95% of the data are at or below for respiratory rates in breath per minute during the first 3 years of infancy are given by y=101.82411-0.0125995x+0.00013401x2 for awake infants and y=101.72858-0.0139928x+0.00017646x2 for sleeping infants, where x is the age in months. Source: Pediatrics. a. What is the domain for each function? b. For each respiratory rate, is the rate decreasing or increasing over the first 3 years of life? Hint: Is the graph of the quadratic in the exponent opening upward or downward? Where is the vertex? c. Verify your answer to part b using a graphing calculator. d. For a 1- year-old infant in the 95 th percentile, how much higher is the walking respiratory rate then the sleeping respiratory rate? e. f.arrow_forward
- Can the average rate of change of a function be constant?arrow_forwardTable 6 shows the population, in thousands, of harbor seals in the Wadden Sea over the years 1997 to 2012. a. Let x represent time in years starting with x=0 for the year 1997. Let y represent the number of seals in thousands. Use logistic regression to fit a model to these data. b. Use the model to predict the seal population for the year 2020. c. To the nearest whole number, what is the limiting value of this model?arrow_forwardTable 2 shows a recent graduate’s credit card balance each month after graduation. a. Use exponential regression to fit a model to these data. b. If spending continues at this rate, what will the graduate’s credit card debt be one year after graduating?arrow_forward
 Calculus For The Life SciencesCalculusISBN:9780321964038Author:GREENWELL, Raymond N., RITCHEY, Nathan P., Lial, Margaret L.Publisher:Pearson Addison Wesley,
 Functions and Change: A Modeling Approach to Coll...AlgebraISBN:9781337111348Author:Bruce Crauder, Benny Evans, Alan NoellPublisher:Cengage Learning
 Algebra & Trigonometry with Analytic GeometryAlgebraISBN:9781133382119Author:SwokowskiPublisher:Cengage
 College Algebra (MindTap Course List)AlgebraISBN:9781305652231Author:R. David Gustafson, Jeff HughesPublisher:Cengage Learning