
Videos
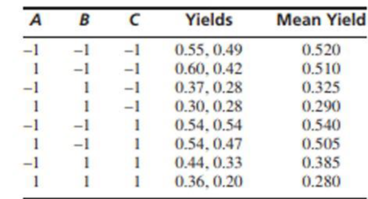
The article “Efficient Pyruvate Production by a Multi-Vitamin Auxotroph of Torulopsis glabrata: Key Role and Optimization of Vitamin Levels” (Y. Li. J. Chen, ct al. Applied Microbiology and Biotechnology, 200l:680–685) investigates the effects of the levels of several vitamins in a cell culture on the yield (in g/L) of pyruvate, a useful organic acid. The data in the following table are presented as two replicates of a 23 design. The factors are A: nicotinic acid. B: thiamine, and C: biotin. (Two statistically insignificant factors have been dropped. In the article, each factor was tested at four levels: we have collapsed these to two.)
- a. Compute estimates of the main effects and interactions, and the sum of squares and P-value for each.
- b. Is the additive model appropriate?
- c. What conclusions about the factors can be drawn from these results?
a.
Obtain the estimates of the main effects and interaction, and sum of squares and P- value for the each treatment combination.
Answer to Problem 4E
The estimates of the main effects and interaction, and sum of squares and P- value for the each treatment combination are given below:
ANOVA table:
| Variable | Effect | DF | Sum of squares | Mean Square | F | P |
| A | –0.04625 | 1 | 0.008556 | 0.008556 | 1.57 | 0.245 |
| B | –0.19875 | 1 | 0.158006 | 0.158006 | 29.03 | 0.001 |
| C | 0.01625 | 1 | 0.001056 | 0.001056 | 0.19 | 0.671 |
| AB | –0.02375 | 1 | 0.002256 | 0.002256 | 0.41 | 0.538 |
| AC | –0.02375 | 1 | 0.002256 | 0.002256 | 0.41 | 0.538 |
| BC | 0.00875 | 1 | 0.000306 | 0.000306 | 0.06 | 0.818 |
| ABC | –0.01125 | 1 | 0.000506 | 0.000506 | 0.09 | 0.768 |
| Error | 8 | 0.043550 | 0.005444 | |||
| Total | 15 |
Explanation of Solution
Given info:
The information is based on conducting the experiment on cell culture on the yield of pyruvate which has two levels for the factors of nicotinic acid (A), thiamine (B), and biotin (C). The experiment of chemical reaction has been conducted twice.
Calculation:
Denote the average yield of the factor A as
Factor A denotes the nicotinic, Factor B denotes the thiamine and Factor C denotes the biotin.
The effect estimate of the treatments is:
The effect estimate of treatment A is:
Substitute the corresponding values of mean yield,
The effect estimate of treatment B is:
The effect estimate of treatment C is:
The effect estimate of treatment AB is:
The effect estimate of treatment AC is:
The effect estimate of treatment BC is:
The effect estimate of treatment ABC is:
The estimates of the main effects and interaction, and sum of squares and P- value for the each treatment combination are given below:
Step-by-step procedure for finding the factorial design table is as follows:
Software procedure:
- Choose Stat > DOE > Factorial > Create Factorial Design.
- Under Type of Design, choose General full factorial design.
- From Number of factors, choose 3.
- Click Designs.
- In Factor A, type A under Name and type 2 Under Number of Levels.
- In Factor B, type B under Name and type 2 Under Number of Levels.
- . In Factor C, type C under Name and type 2 Under Number of Levels.
- From Number of replicates, choose 2.
- Click OK.
- Select Summary table under Results.
- Click OK.
- Enter the corresponding Yield in the newly created factorial design worksheet based on the levels of each factor.
Step-by-step procedure for finding the ANOVA table is as follows:
- Choose Stat > DOE > Factorial > Analyze Factorial Design.
- In Response, enter Yield.
- In Terms, select all the terms.
- In Results, choose “Model summary and ANOVA table”.
- Click OK in all the dialog boxes.
Output obtained by MINITAB procedure is as follows:
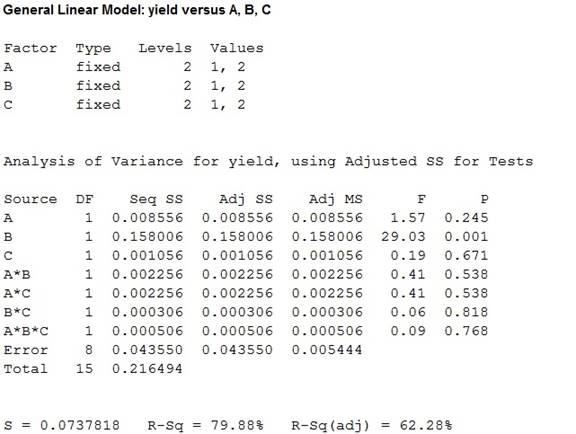
The sum of squares and P- values has been obtained for each treatment combination by using MINITAB.
Thus, the estimates of the main effects and interaction, and sum of squares and P- value for the each treatment combination are given below:
ANOVA table:
| Variable | Effect | DF | Sum of squares | Mean Square | F | P |
| A | –0.04625 | 1 | 0.008556 | 0.008556 | 1.57 | 0.245 |
| B | –0.19875 | 1 | 0.158006 | 0.158006 | 29.03 | 0.001 |
| C | 0.01625 | 1 | 0.001056 | 0.001056 | 0.19 | 0.671 |
| AB | –0.02375 | 1 | 0.002256 | 0.002256 | 0.41 | 0.538 |
| AC | –0.02375 | 1 | 0.002256 | 0.002256 | 0.41 | 0.538 |
| BC | 0.00875 | 1 | 0.000306 | 0.000306 | 0.06 | 0.818 |
| ABC | –0.01125 | 1 | 0.000506 | 0.000506 | 0.09 | 0.768 |
| Error | 8 | 0.043550 | 0.005444 | |||
| Total | 15 |
b.
Check whether the additive model is appropriate.
Answer to Problem 4E
Yes, the additive model is appropriate .
Explanation of Solution
Justification:
Principle rule to hold an additive model:
The additive model is acceptable when the interactions are small.
Hence the additive model is appropriate but interaction effect obtained in previous part (a) does not provide significant results.
c.
State whether any main effects and interaction are important.
Answer to Problem 4E
There is sufficient evidence to conclude that there is no significant difference between the means of two levels in main effect A at
There is sufficient evidence to conclude that there is significant difference between the means of two levels in main effect B at
There is sufficient evidence to conclude that there is no significant difference between the means of two levels in main effect C at
There is sufficient evidence to conclude that the interaction is not significant at
Explanation of Solution
Calculation:
The testing of hypotheses is as follows:
State the hypotheses:
Main factor A:
Null hypothesis:
Alternative hypothesis:
Main factor B:
Null hypothesis:
Alternative hypothesis:
Interaction AB:
Null hypothesis:
Alternative hypothesis:
Interaction AC:
Null hypothesis:
Alternative hypothesis:
Interaction BC:
Null hypothesis:
Alternative hypothesis:
Interaction ABC:
Null hypothesis:
Alternative hypothesis:
Assume that the level of significance as 0.05.
From the MINITAB output obtained in previous part (a), the P- value for main effects and interaction are given below:
| Treatment | P |
| A | 0.245 |
| B | 0.001 |
| C | 0.671 |
| AB | 0.538 |
| AC | 0.538 |
| BC | 0.818 |
| ABC | 0.768 |
Decision:
If
If
Conclusion:
Factor A:
Here, the P-value is greater than the level of significance.
That is,
By rejection rule, fail to reject the null hypothesis.
Thus, there is sufficient evidence to conclude that there is no significant difference between the means of two levels in main effect A at
Factor B:
Here, the P-value is less than the level of significance.
That is,
By rejection rule, reject the null hypothesis.
Thus, there is sufficient evidence to conclude that there is significant difference between the means of two levels in main effect B at
Factor C:
Here, the P-value is greater than the level of significance.
That is,
By rejection rule, fail to reject the null hypothesis.
Thus, there is sufficient evidence to conclude that there is no significant difference between the means of two levels in main effect C at
Interaction AB:
Here, the P-value is greater than the level of significance.
That is,
By rejection rule, fail to reject the null hypothesis.
Thus, there is sufficient evidence to conclude that the interaction AB is not significant at
Interaction AC:
Here, the P-value is greater than the level of significance.
That is,
By rejection rule, fail to reject the null hypothesis.
Thus, there is sufficient evidence to conclude that the interaction AC is not significant at
Interaction BC:
Here, the P-value is greater than the level of significance.
That is,
By rejection rule, fail to reject the null hypothesis.
Thus, there is sufficient evidence to conclude that the interaction BC is not significant at
Interaction ABC:
Here, the P-value is greater than the level of significance.
That is,
By rejection rule, fail to reject the null hypothesis.
Thus, there is sufficient evidence to conclude that the interaction ABC is not significant at
Hence the P-value of Factor B states that it has more effect on the yield than Factor A and Factor C.
Want to see more full solutions like this?
Chapter 9 Solutions
Statistics for Engineers and Scientists
Additional Math Textbook Solutions
Elementary Statistics: Picturing the World (7th Edition)
Elementary Statistics: Picturing the World (6th Edition)
Elementary Statistics
Elementary Statistics: A Step By Step Approach
Elementary Statistics Using The Ti-83/84 Plus Calculator, Books A La Carte Edition (5th Edition)
Applied Statistics in Business and Economics


- The depth of wetting of a soil is the depth to which water content will increase owing to extemal factors. The article "Discussion of Method for Evaluation of Depth of Wetting in Residential Areas" (J. Nelson, K. Chao, and D. Overton, Journal of Geotechnical and Geoenvironmental Engineering, 2011:293-296) discusses the relationship between depth of wetting beneath a structure and the age of the structure. The article presents measurements of depth of wetting, in meters, and the ages, in years, of 21 houses, as shown in the following table. Age Depth 7.6 4 4.6 6.1 9.1 3 4.3 7.3 5.2 10.4 15.5 5.8 10.7 4 5.5 6.1 10.7 10.4 4.6 7.0 6.1 14 16.8 10 9.1 8.8 Compute the least-squares line for predicting depth of wetting (y) from age (x). b. Identify a point with an unusually large x-value. Compute the least-squares line that results from deletion of this point. Identify another point which can be classified as an outlier. Compute the least-squares line that results from deletion of the outlier,…arrow_forwardThe article "Celulose Acetate Microspheres Prepared by O/W Emulsification and Solvent Evaporation Method" (K. Soppinmath, A. Kulkami, et al., Journal of Microencapsulation, 2001:811-817) describes a study of the effects of the concentrations of polyvinyl alcohol (PVAL) and dichloromethane (DCM) on the encapsulation efficiency in a process that produces microspheres containing the drug ibuprofen. There were three concentrations of PVAL (measured in units of % wiv) and three of DCM (in mL). The results presented in the following table are consistent with the means and standard deviations presented in the article. PVAL DCM = 50 DCM = 40 DCM = 30 0.5 98.983 99.268 95.149 96.810 94.572 86.718 75.288 74.949 72.363 1.0 89.827 94.136 96.537 82.352 79.156 80.891 76.625 76.941 72.635 2.0 95.095 95.153 92.353 86.153 91.653 87.994 80.059 79.200 77.141 Construct an ANOVA table. You may give ranges for the P-values. b. Discuss the relationships among PVAL concentration, DCM concentration, and…arrow_forwardThe article "Effect of Granular Subbase Thickness on Airfield Pavement Structural Response" (K. Gopalakrishnan and M. Thompson, Journal of Materials in Civil Engineering, 2008:331-342) presents a study of the amount of surface deflection caused by aircraft landing on an airport runway. A load of 160 kN was applied to a runway surface, and the amount of deflection in mm (y) was measured at various distances in m (x) from the point of application. The results are presented in the following table. y 0.000 3.24 0.305 2.36 0.610 1.42 0.914 0.87 1.219 0.54 1.524 0.34 1.830 0.24 a. Fit the linear model y = Bo + B1x + ɛ. For each coefficient, test the hypothesis that the coefficient is equal to 0. b. Fit the quadratic model y = Bo + Bịx + B2x² + ɛ. For each coefficient, test the hypothesis that the coefficient is equal to 0. %3D Fit the cubic model y = Bo + B1x + B2x? + B3x + E. For each coefficient, test the C. hypothesis that the coefficient is equal to 0. d. Which of the models in parts (a)…arrow_forward
- Captopril is a drug designed to lower systolic blood pressure. When subjects were treated with this drug, their systolic blood pressure readings (in mm Hg) were measured before and after the drug was taken. Results are given in the accompanying table (based on data from “Essential Hypertension: Effect of an Oral Inhibitor of Angiotensin-Converting Enzyme”, by MacGregor et al., BMJ, Vol. 2). Using a 0.01 significance level, is there sufficient evidence to support the claim that captopril has an effect on systolic blood pressure? i) Use the Wilcoxon signed-ranks test to conduct the required test without using "wilcox.test" function in R. Please state the hypothesis, provide the p-value, and the conclusion in the context of the problem. ii) Use the Wilcoxon signed-ranks test to conduct the required test using "wilcox.test" function in R. Please present a screenshot of the R output of your call to the function wilcox.test. iii) Would you recommend the Wilcoxon signed-ranks test over the…arrow_forwardThe article "Influence of Freezing Temperature on Hydraulic Conductivity of Silty Clay" (J. Konrad and M. Samson, Journal of Geotechnical and Geoenvironmental Engineering, 2000:180–187) describes a study of factors affecting hydraulic conductivity of soils. The measurements of hydraulic conductivity in units of 108 cm/s (y), initial void ratio (x), and thawed void ratio (x2) for 12 specimens of silty clay are presented in the following table. y 1.01 1.12 1.04 1.30 1.01 1.04 0.955 1.15 1.23 1.28 1.23 1.30 0.84 0.88 0.85 0.95 0.88 0.86 0.85 0.89 0.90 0.94 0.88 0.90 X1 0.81 0.85 0.87 0.92 0.84 0.85 0.85 0.86 0.85 0.92 0.88 0.92 X2 Fit the model y = Bo + fix1 + e. For each coefficient, test the null hypothesis that it is equal to 0. Fit the model y = Bo + Bzx2 + e. For each coefficient, test the null hypothesis that it is equal to 0. Fit the model y = Bo + BzX1 + Bzxz + e. For each coefficient, test the null hypothesis that it is equal to 0. d. Which of the models in parts (a) to (c) is…arrow_forward8-56. + An article in the Australian Journal of Agricultural Research [“Non-Starch Polysaccharides and Broiler Perfor- mance on Diets Containing Soyabean Meal as the Sole Protein Concentrate" (1993, Vol. 44(8), pp. 1483–1499)] determined that the essential amino acid (Lysine) composition level of soy- bean meals is as shown here (g/kg): 22.2 24.7 20.9 26.0 27.0 24.8 26.5 23.8 25.6 23.9 (a) Construct a 99% two-sided confidence interval for o. (b) Calculate a 99% lower confidence bound for o. (c) Calculate a 90% lower confidence bound for o. (d) Compare the intervals that you have computed.arrow_forward
- The article “Effect of Granular Subbase Thickness on Airfield Pavement Structural Response” (K. Gopalakrishnan and M. Thompson, Journal of Materials in Civil Engineering, 2008:331–342) presents a study of the effect of the subbase thickness on the amount of surface deflection caused by aircraft landing on an airport runway. In six applications of a 160 kN load on a runway with a subbase thickness of 864 mm, the average surface deflection was 2.03 mm with a standard deviation of 0.090 mm. Find a 90% confidence interval for the mean deflection caused by a 160 kN load.arrow_forwardThe article "Copper Oxide Mounted on Activated Carbon as Catalyst for Wet Air Oxidation of Aqueous Phenol1. Kinetic and Mechanistic Approaches" (P. Álvarez, D. McLurgh, and P. Plucinski, Industrial Engineering and Chemistry Research, 2002: 2147-2152) reports the results of experiments to describe the mechanism of the catalytic wet air oxidation of aqueous phenol. In one set of experiments, the initial oxidation rate (in kilograms of phenol per kilogram of catalyst per hour) and the oxygen concentratioan (in mol/m) were measured. The results (read from a graph) are presented in the following table. Rate (y) 0.44 0.49 0.60 0.64 0.72 3.84 4.76 6.08 7.06 8.28 O, concentration (x) a Itis known that x and y are related by an equation of the form y = kx, where r is the oxygen reaction order. Make appropriate transformations to express this as a linear equation. b. Estimate the values of k and r by computing the least-squares line. Based on these data, is it plausible that the oxygen reaction…arrow_forward5.1 Byers and Williams (Viscosities of Binary and Ternary Mixtures of Polyaromatic Hydrocarbons," Journal of Chemical and Engineering Data, 32, 349 – 354, 1987) studied the impact of temperature (the regressor) on the viscosity (the response) of toluene- tetralin blends. The following table gives the data for blends with a 0.4 molar fraction of toluene. Temperature (°C) Viscosity (mPa·s) 1.133 24.9 35.0 0.9772 44.9 0.8532 55.1 0.7550 65.2 0.6723 75.2 0.6021 85.2 0.5420 95.2 0.5074 b. Fit the straight line model. Compute the summary statistics and the residual plots. What are your conclusions regarding model adequacy?arrow_forward
- Determine the kurtosis if the data given is a sample.arrow_forward5.1 Byers and Williams (Viscosities of Binary and Ternary Mixtures of Polyaromatic Hydrocarbons," Journal of Chemical and Engineering Data, 32, 349 – 354, 1987) studied the impact of temperature (the regressor) on the viscosity (the response) of toluene- tetralin blends. The following table gives the data for blends with a 0.4 molar fraction of toluene. Temperature (°C) Viscosity (mPa·s) 24.9 1.133 35.0 0.9772 44.9 0.8532 55.1 0.7550 65.2 0.6723 75.2 0.6021 85.2 0.5420 95.2 0.5074 c. Basic principles of physical chemistry suggest that the viscosity is an exponential function of the temperature. Repeat part b using the appropriate transformation based on this information.arrow_forward5.1 Byers and Williams (Viscosities of Binary and Ternary Mixtures of Polyaromatic Hydrocarbons," Journal of Chemical and Engineering Data, 32, 349 – 354, 1987) studied the impact of temperature (the regressor) on the viscosity (the response) of toluene - tetralin blends. The following table gives the data for blends with a 0.4 molar fraction of toluene. + Temperature (°C) Viscosity (mPa·s) 1.133 24.9 35.0 0.9772 44.9 0.8532 55.1 0.7550 65.2 0.6723 75.2 0.6021 85.2 0.5420 95.2 0.5074 a. Plot a scatter diagram. Does it seem likely that a straight line model will be adequate?arrow_forward
 MATLAB: An Introduction with ApplicationsStatisticsISBN:9781119256830Author:Amos GilatPublisher:John Wiley & Sons Inc
 Probability and Statistics for Engineering and th...StatisticsISBN:9781305251809Author:Jay L. DevorePublisher:Cengage Learning
 Statistics for The Behavioral Sciences (MindTap C...StatisticsISBN:9781305504912Author:Frederick J Gravetter, Larry B. WallnauPublisher:Cengage Learning
 Elementary Statistics: Picturing the World (7th E...StatisticsISBN:9780134683416Author:Ron Larson, Betsy FarberPublisher:PEARSON
 The Basic Practice of StatisticsStatisticsISBN:9781319042578Author:David S. Moore, William I. Notz, Michael A. FlignerPublisher:W. H. Freeman
 Introduction to the Practice of StatisticsStatisticsISBN:9781319013387Author:David S. Moore, George P. McCabe, Bruce A. CraigPublisher:W. H. Freeman