
Videos
The accompanying summary data on compression strength (lb) for 12 × 10 × 8 in. boxes appeared in the article “Compression of Single-Wall Corrugated Shipping Containers Using Fixed and Floating Test Platens” (J. Testing and Evaluation, 1992: 318–320). The authors stated that “the difference between the compression strength using fixed and floating platen method was found to be small compared to normal variation in compression strength between identical boxes.” Do you agree? Is your analysis predicated on any assumptions?
| Sample | Sample | Sample | |
| Method | Size | SD | |
| Fixed | 10 | 807 | 27 |
| Floating | 10 | 757 | 41 |
Check whether the claim that the “difference between compression strength using fixed method and floating platen is smaller than the normal variation in compression strength between identical boxes” is appropriate.
Check whether the analysis is based on any assumptions.
Answer to Problem 67SE
The authors claim that “difference between compression strength using fixed method and floating platen is smaller than the normal variation in compression strength between identical boxes” is not agreed.
Yes, the analysis is based on certain assumptions.
Explanation of Solution
Given info:
Let
Calculation:
Here,
The test hypotheses are,
Null hypothesis:
That is, the mean compression strength fixed method is different from the floating platen method.
Alternative hypothesis:
That is, there is evidence that the mean compression strength fixed method is different from the floating platen method.
Assumption for the two sample t-test:
- The samples X and Y are selected from the population at random.
- The samples X and Y are independent of each other.
- Samples must be distributed normally.
Here, the samples selected from the fixed method and floating method were selected at random and independently. Moreover, the sample size is large and distributed normally. Hence, the assumptions are satisfied.
Conduct the two-sample t-test to test the hypotheses.
Test statistic:
Step-by-step procedure to obtain the test statistic using the MINITAB software:
- Choose Stat > Basic Statistics > 2-Sample t.
- Choose Sample from the columns.
- In first, enter Sample size as 10, Mean as 807, Standard deviation as 27.
- In second, enter Sample size as 10, Mean as 757, Standard deviation as 41.
- Choose Options.
- In Confidence level, enter 95.
- In Alternative, select Not equal.
- Click OK in all the dialog boxes.
Output using the MINITAB software is given below:
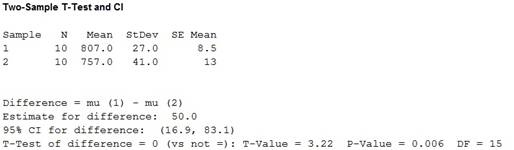
From the output, the test statistic is 3.22 and the P- value is 0.006.
Rejection rule:
If
Conclusion:
Here, the P-value is less than the level of significance.
That is,
Therefore, the decision is “reject the null hypothesis”.
Thus, it can be concluded that there is evidence that the mean compression strength fixed method is different from the floating platen method.
The authors claim that “difference between compression strength using fixed method and floating platen is smaller than the normal variation in compression strength between identical boxes” is not agreed.
Here, the sample size of the compression strength data is small and it is assumed to be distributed to normal. Also, it is assumed that the data were selected at random and independent.
Want to see more full solutions like this?
Chapter 9 Solutions
EBK PROBABILITY AND STATISTICS FOR ENGI


- A study of the properties of metal plate-connected trusses used for roof support yielded the following observations on axial stiffness index (kips/in.) for plate lengths 4, 6, 8, 10, and 12 in: 4: 329.2 409.5 311.0 326.5 316.8 349.8 309.7 6: 425.1 347.2 361.0 404.5 331.0 348.9 381.7 8: 389.4 366.2 351.0 357.1 409.9 367.3 382.0 10: 341.7 452.9 461.4 433.1 410.6 384.2 362.6 12: 414.4 441.8 419.9 410.7 473.4 441.2 465.8 USE SALT Does variation in plate length have any effect on true average axial stiffness? State the relevant hypotheses using analysis of variance. O Ho: M₁ = H₂ = 13 = H4 = 1₂ H₂: all five μ's are unequal O Ho: My H₂ H3 ‡ M4 # M5 H₂: at least two μ's are equal O Ho: My # H₂ H3 # H4 # H5 H₂: all five us are equal = = o Hỏi khi là không = 3 = Mà khô H₂: at least two μ's are unequal Test the relevant hypotheses using analysis of variance with a = 0.01. Display your results in an ANOVA table. (Round your answers to two decimal places.) Sum of Squares Source Treatments Error…arrow_forwardA study of the properties of metal plate-connected trusses used for roof support yielded the following observations on axial stiffness index (kips/in.) for plate lengths 4, 6, 8, 10, and 12 in: 4: 315.2 409.5 311.0 326.5 316.8 349.8 309.7 6: 405.1 347.2 361.0 404.5 331.0 348.9 381.7 8: 399.4 366.2 351.0 357.1 409.9 367.3 382.0 10: 353.7 452.9 461.4 433.1 410.6 384.2 362.6 12: 417.4 441.8 419.9 410.7 473.4 441.2 465.8 n USE SALT Does variation in plate length have any effect on true average axial stiffness? State the relevant hypotheses using analysis of variance. O Ho: H1# H2 # Hz# H4# H5 H: at least two µ's are equal O Ho: H1 = H2 = H3= H4= H5 H: at least two u's are unequal O Ho: H1 # H2 # Hz# H4# Hs H: all five u's are equal O Ho: H1 = H2 = Hz3 = H4= Hs H: all five u,'s are unequal Test the relevant hypotheses using analysis of variance with a = 0.01. Display your results in an ANOVA table. (Round your answers to two decimal places.) Degrees of freedom Sum of Squares Mean Source…arrow_forwardA study of the properties of metal plate-connected trusses used for roof support yielded the following observations on axial stiffness index (kips/in.) for plate lengths 4, 6, 8, 10, and 12 in: 4: 333.2 409.5 311.0 326.5 316.8 349.8 309.7 6: 433.1 347.2 361.0 404.5 331.0 348.9 381.7 8: 382.4 366.2 351.0 357.1 409.9 367.3 382.0 10: 350.7 452.9 461.4 433.1 410.6 384.2 362.6 12: 413.4 441.8 419.9 410.7 473.4 441.2 465.8 LUSE SALT Does variation in plate length have any effect on true average axial stiffness? State the relevant hypotheses using analysis of variance. O Hoi Hy #fly #Hz" Ha #Hs H: all five μ's are equal O Hoi H₂H₂ = H3 = HaHs H: at least two μ's are unequal O Hoi H₂ = H₂ = H₂ "HaHs H: all five μ's are unequal O Hoi H₂ #4₂ # Hz*H4 *H5 H: at least two μ's are equal Test the relevant hypotheses using analysis of variance with a = 0.01. Display your results in an ANOVA table. (Round your answers to two decimal places.) Degrees of Sum of Mean freedom Squares Squares Error Total…arrow_forward
- Artificial joints consist of a ceramic ball mounted on a taper. The article "Friction in Orthopaedic Zirconia Taper Assemblies" (W. Macdonald, A. Áspenberg, et al., Proceedings of the Institution of Mechanical Engineers, 2000: 685-692) presents data on the coefficient of friction for a push-on load of 2 kN for taper assemblies made from two zirconium alloys and employing three different neck lengths. Five measurements were made for each combination of material and neck length. The results presented in the following table are consistent with the cell means and standard deviations presented in the article. Тарег Material Neck Length Coefficient of Friction CPTI-ZIO2 CPTI-Z:O, CPTI-Z:O, Long TIAlloy-ZrO, Short TiAlloy-ZrO, Medium TiAlloy-ZrO, Long Short 0.254 0.195 0.281 0.289 0.220 Medium 0.196 0.220 0.185 0.259 0.197 0.329 0.481 0.320 0.296 0.178 0.150 0.118 0.158 0.175 0.131 0.180 0.184 0.154 0.156 0.177 0.178 0.198 0.201 0.199 0.210 Compute the main effects and interactions. Construct…arrow_forwardA study of the properties of metal plate-connected trusses used for roof support yielded the following observations on axial stiffness index (kips/in.) for plate lengths 4, 6, 8, 10, and 12 in: 4: 321.2 409.5 311.0 326.5 316.8 349.8 309.7 6: 439.1 347.2 361.0 404.5 331.0 348.9 381.7 8: 390.4 366.2 351.0 357.1 409.9 367.3 382.0 10: 362.7 452.9 461.4 433.1 410.6 384.2 362.6 12: 402.4 441.8 419.9 410.7 473.4 441.2 465.8 USE SALT Does variation in plate length have any effect on true average axial stiffness? State the relevant hypotheses using analysis of variance. ○ Ho: H₁ = H₂ = H3 = H4=H5 Ha: all five u's are unequal O Ho: H₁ H₂ H3 H4 H5 Ha: all five μ's are equal Ho H₁ = ₂ = 3 = H4 = 5 H₂: at least two μ's are unequal Ho: H₁ H₂ H3 H4 H5 Ha: at least two μ's are equal Test the relevant hypotheses using analysis of variance with a = 0.01. Display your results in an ANOVA table. (Round your answers to two decimal places.) Mean Degrees of Sum of freedom Squares Squares Source Treatments…arrow_forwardA study of the properties of metal plate-connected trusses used for roof support yielded the following observations on axial stiffness index (kips/in.) for plate lengths 4, 6, 8, 10, and 12 in: 4: 323.2 409.5 311.0 326.5 316.8 349.8 309.7 6: 423.1 347.2 361.0 404.5 331.0 348.9 381.7 8: 393.4 366.2 351.0 357.1 409.9 367.3 382.0 10: 362.7 452.9 461.4 433.1 410.6 384.2 362.6 12: 418.4 441.8 419.9 410.7 473.4 441.2 465.8 Does variation in plate length have any effect on true average axial stiffness? State the relevant hypotheses using analysis of variance. H0: ?1 ≠ ?2 ≠ ?3 ≠ ?4 ≠ ?5Ha: at least two ?i's are equalH0: ?1 = ?2 = ?3 = ?4 = ?5Ha: all five ?i's are unequal H0: ?1 = ?2 = ?3 = ?4 = ?5Ha: at least two ?i's are unequalH0: ?1 ≠ ?2 ≠ ?3 ≠ ?4 ≠ ?5Ha: all five ?i's are equal Test the relevant hypotheses using analysis of variance with ? = 0.01. Display your results in an ANOVA table. (Round your answers to two decimal places.) Source Degrees offreedom Sum…arrow_forward
- The table below shows the results from the specific gravity (S.G.) test performed in a soil laboratory including twenty samples of sand. Determine the Coefficient of Quartile Variation.arrow_forwardThe article "Bone Density and Insertion Torque as Predictors of Anterior Cruciate Ligament Graft Fixation Strength"t gave the accompanying data on maximum insertion torque (N• m) and yield load (N), the latter being one measure of graft strength, for 15 different specimens. Torque 1.8 2.2 1.9 1.3 2.1 2.2 1.6 2.1 1.2 1.8 2.6 2.5 2.5 1.7 1.6 Load 491 477 598 361 605 671 466 431 384 422 554 577 642 348 446 (a) Is it plausible that yield load is normally distributed? Yes, there are more than thirty data values. No, a normal probability plot of yield load is not quite linear. Yes, a normal probability plot of yield load is quite quadratic. No, there is not more than thirty data values. Yes, a normal probability plot of yield load is quite linear. (b) Estimate true average yield load by calculating a confidence interval with a confidence level of 95%. (Round your answer to two decimal places.) Interpret the interval. We are 95% confident that the true population average yield load lies below…arrow_forwardComputer chips often contain surface imperfections.For a certain type of computer chip, theprobability mass function of the number of defects X is presented in the following table.arrow_forward
- An article in the Fire Safety Journal (“The Effect of Nozzle Design on the Stability and Performance of Turbulent Water Jets,” Vol. 4, August 1981) describes an experiment in which a shape factor was determined for several different nozzle designs at six levels of jet efflux velocity. Interest focused on potential differences between nozzle designs (blocks), with velocity considered as a nuisance variable. The data are shown below: Jet Efflux Velocity (m/s) Nozzle Design 11.73 14.37 16.59 20.43 23.46 28.74 1 0.78 0.80 0.81 0.75 0.77 0.78 2 0.85 0.85 0.92 0.86 0.81 0.83 3 0.93 0.92 0.95 0.89 0.89 0.83 4 1.14 0.97 0.98 0.88 0.86 0.83 5 0.97 0.86 0.78 0.76 0.76 0.75 1) Write the null hypothesis and the alternative hypothesis (for the factor). 2) Find the ANOVA table. (round to five decimal places). 3) What is your decision about the null hypothesis, consider ?. 4) If your decision in part (4) was reject , perform Tukey test to determine which pairwise means are…arrow_forwardIn rock blasting, the peak particle velocity (PPV) depends both on the distance from the blast and on the amount of charge. The article "Prediction of Particle Velocity Caused by Blasting for an Infrastructure Excavation Covering Granite Bedrock" (A. Kahriman, Mineral Resources Engineering, 2001:205-218) presents data on PPV, scaled distance (which is equal to the distance divided by the square root of the charge), and the amount of charge. The following table presents the values of PPV, scaled distance, and amount of charge for 15 blasts. Scaled Distance (m/kg0.5) PPV Amount of Charge (mm/s) (kg) 1.4 47.33 4.2 15.7 9.6 92.0 2.54 15.8 40.0 1.14 24.3 48.7 0.889 23.0 95.7 1.65 12.7 67.7 1.4 39.3 13.0 26.8 8.0 70.0 1.02 29.94 13.5 4.57 10.9 41.0 6.6 8.63 108.8 1.02 28.64 27.43 3.94 18.21 59.1 1.4 33.0 11.5 1.4 34.0 175.0 Fit the model In PPV = Bo + B1 In Scaled Distance + B2 In Charge + E. Compute the P- value for testing Ho : B¡ = 0 for Bo. B1, and Bz. b. The article claims that the…arrow_forwardGrip is applied to produce normal surface forces thatcompress the object being gripped. Examples includetwo people shaking hands, or a nurse squeezing apatient’s forearm to stop bleeding. The article“Investigation of Grip Force, Normal Force, ContactArea, Hand Size, and Handle Size for CylindricalHandles” (Human Factors, 2008: 734–744) includedthe following data on grip strength (N) for a sample of 42individuals:16 18 18 26 33 41 54 56 66 68 87 91 9598 106 109 111 118 127 127 135 145 147 149 151 168172 183 189 190 200 210 220 229 230 233 238 244 259294 329 403a. Construct a stem-and-leaf display based on repeatingeach stem value twice, and comment on interestingfeatures.b. Determine the values of the fourths and thefourthspread.c. Construct a boxplot based on the five-number summary,and comment on its features.d. How large or small does an observation have to be toqualify as an outlier? An extreme outlier? Are thereany outliers?e. By how much could the observation 403, currentlythe…arrow_forward
 MATLAB: An Introduction with ApplicationsStatisticsISBN:9781119256830Author:Amos GilatPublisher:John Wiley & Sons Inc
 Probability and Statistics for Engineering and th...StatisticsISBN:9781305251809Author:Jay L. DevorePublisher:Cengage Learning
 Statistics for The Behavioral Sciences (MindTap C...StatisticsISBN:9781305504912Author:Frederick J Gravetter, Larry B. WallnauPublisher:Cengage Learning
 Elementary Statistics: Picturing the World (7th E...StatisticsISBN:9780134683416Author:Ron Larson, Betsy FarberPublisher:PEARSON
 The Basic Practice of StatisticsStatisticsISBN:9781319042578Author:David S. Moore, William I. Notz, Michael A. FlignerPublisher:W. H. Freeman
 Introduction to the Practice of StatisticsStatisticsISBN:9781319013387Author:David S. Moore, George P. McCabe, Bruce A. CraigPublisher:W. H. Freeman