
Concept explainers
Videos
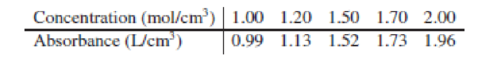
The Beer–Lambert law relates the absorbance A of a solution to the concentration C of a species in solution by A = MLC, where L is the path length and M is the molar absorption coefficient. Assume that L = 1 cm. Measurements of A are made at various concentrations. The data are presented in the following table.
- a. Let
- b. What value does the Beer–Lambert law assign to β0?
- c. What physical quantity does
- d. Test the hypothesis H0 : β0 = 0. Is the result consistent with the Beer–Lambert law?
a.
Find the values of
Answer to Problem 1SE
The values of
Explanation of Solution
Calculation:
The given information is that the Beer–Lambert law relates the absorbance A of a solution to the concentration C of a species in solution by,
Where L is the path length and M is the molar absorption coefficient.
Least-squares line:
Software Procedure:
Step-by-step procedure to obtain the least-squares line using the MINITAB software is given below:
- Choose Stat > Regression > Regression > Fit Regression Model.
- In Responses, enter “Absorbance”.
- In Continuous predictors, enter “Concentration”.
- Check Results.
- In Display of results, choose Simple tables.
- Click OK.
Output using the MINITAB software is given below:
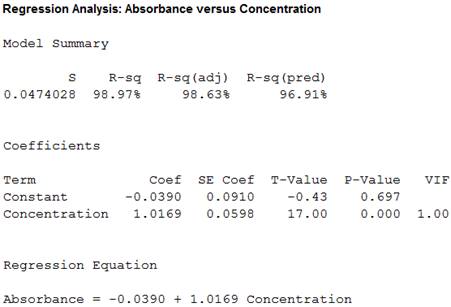
From the MINITAB output,
b.
Find the value does the Beer-Lambert law assign to
Explanation of Solution
Calculation:
Here, the variable C is independent, the variable A is dependent, the length L is constant and M is the molar absorption coefficient.
The equation of the Beer-Lambert law is,
The equation of the least-squares line for predicting absorbance (A) from concentration (C) is,
On comparing equation (1) and (2),
Thus, the coefficient
c.
Find the physical quantity does
Explanation of Solution
Justification:
From part b., comparing equation (1) and (2) is,
Therefore, the coefficient
d.
Test the hypothesis
Check whether the result is consistent with the Beer-Lambert law.
Answer to Problem 1SE
Yes, the result is consistent with the Beer-Lambert law.
Explanation of Solution
Calculation:
State the null and alternative hypotheses.
Null hypothesis:
Alternative hypothesis:
From the MINITAB obtained in part a., the test statistic for slope is –0.43 and the P- value is 0.697.
Conclusion:
Here, the P-value is not small.
That is, the P-value is greater than the level of significance, 0.05.
Therefore, the null hypothesis is not rejected.
Hence, it can be concluded that
Thus, the result is consistent with the Beer-Lambert law.
Want to see more full solutions like this?
Chapter 7 Solutions
Statistics for Engineers and Scientists
Additional Math Textbook Solutions
Elementary Statistics: Picturing the World (6th Edition)
Business Analytics
Essentials of Statistics (6th Edition)
Intro Stats, Books a la Carte Edition (5th Edition)
Statistics: Informed Decisions Using Data (5th Edition)
PRACTICE OF STATISTICS F/AP EXAM


- Wrinkle recovery angle and tensile strength are the two most important characteristics for evaluating the performance of crosslinked cotton fabric. An increase in the degree of crosslinking, as determined by ester carboxyl band absorbance, improves the wrinkle resistance of the fabric (at the expense of reducing mechanical strength). The accompanying data on x = absorbance and y = wrinkle resistance angle was read from a graph in the paper "Predicting the Performance of Durable Press Finished Cotton Fabric with Infrared Spectroscopy".t x 0.115 0.126 0.183 0.246 0.282 0.344 0.355 0.452 0.491 0.554 0.651 y 334 342 355 363 365 372 381 400 392 412 420 Here is regression output from Minitab: Predictor Constant absorb S = 3.60498 Coef 321.878 156.711 SOURCE Regression Residual Error Total R-Sq= 98.5% DF SE Coef 2.483 6.464 1 9 10 SS 7639.0 117.0 7756..0 T 129.64 24.24 P 0.000 0.000. R-Sq (adj) 98.3% MS 7639.0 13.0 F 587.81 (a) Does the simple linear regression model appear to be appropriate?…arrow_forward17.7 Butterfly wings. Researchers studied the morphological attributes of monarch butterflies (Danaus plexippus), a species that undertakes large seasonal migrations over North America. They measured the forewing weight (in milligrams, mg) of a sample of 92 monarch butterflies, all of which had been reared in captivity in identical conditions.° Figure 17.4 shows the output from the statistical software JMP. (The data are also available in the Large.Butterfly the data file if you wish to practice working with your own software.) Estimate with 95% confidence the mean forewing weight of monarch butterflies reared in captivity. Follow the four- step process as illustrated in Example 17.2. 4 STEP そMP FWweight 30 25 20 15 10 11 12 13 14 15 8 9 10 Summary Statistics Mean 11.795652 Std Dev 1.1759413 Std Err Mean 0.1226004 Upper 95% Mean Lower 95% Mean 1 FIGURE 17.4 Software output (JMP) for the forewing weight of monarch 12.039183 11.552122 92 N. butterflies. Countarrow_forwardConsider a simple regression model Y₁ =ß+B_X +u with E(u.IX) = 5. The intercept Bo is interpreted as the mean value of Y; for individuals with X;=0. 0 1 i i O True O Falsearrow_forward
- Q3) An experiment was carried out to investigate variation of solubility of chemical X in water. The quantities in kg that dissolved in 1 liter at various temperatures are show in the table (1). Table (1) Temperature C Mass of X 2.1 2.6 2.9 3.3 15 20 25 30 35 4 50 5.1 70 7 Use the proper methods to answer the following questions: a) Draw a scatter diagram to show the data. b) Estimate the temperature based on the mass of X. c) What quantity might be expected to dissolve at 42 C? Find the quantity that your cquation indicates would dissolve at 10 C and comment on your answer.arrow_forwardA pilot study was performed to investigate the effect of temperature, x (in degree Fahrenheit) on the electrical power consumed, y (in Watt) by an automotive factory. Other factors were kept constant and the data were collected from the study. The summary of the data are given as follows: n = 8, 2x = 401, 2301, x? = 22495 2y? = 666509, Σ > xy = 118652. %3D Compute the equation of the least squares regression line of y on x. Interpret the equation obtained in part (i). Predict the power consumption for a temperature of 65°F. (i) (ii) (iii) (iv) Compute the coefficient of determination and explain.arrow_forwardThe decay of radioactive species can be expressed with the following model: a sin(Q / d) = %3D b Vt +c where: t: is the time (min), and Q is the material radioactivity strength. a and b: model parameters. c: is time dependent lead which has a value of 10 d: is a strength parameter with a value of 100. Use a linear least square regression to fit the given model for the following deacy data and test the statistical goodness of the fit: t 2 8 12 14 17 20 Wingows bu 6.4 ws b 5.9 4.1 3.7 3.5 3.2 3arrow_forward
- Arm circumferences (cm) and heights (cm) are measured from randomly selected adult females. The 146pairs of measurements yield x=34.69cm, y=163.25cm, r=0.075, P-value=0.368, and y=157+0.1826x. Find the best predicted value of y (height) given an adult female with an arm circumference of 40.0cm. Let the predictor variable x be arm circumference and the response variable y be height. Use a 0.05 significance level. The best predicted value is ____cm.arrow_forwardA paper gives data on x = change in Body Mass Index (BMI, in kilograms/meter2) and y = change in a measure of depression for patients suffering from depression who participated in a pulmonary rehabilitation program. The table below contains a subset of the data given in the paper and are approximate values read from a scatterplot in the paper. BMI Change (kg/m²) 0.5 -0.5 0 0.1 0.7 0.8 1 1.5 1.2 1 0.4 0.4 Depression Score Change -1 9 4 4 5 8 13 14 17 18 12 14 The accompanying computer output is from Minitab. Fitted Line Plot Depression score change = 6.512 + 5.472 BMI change 20 S 5.26270 R-Sq 27.16% R-Sq (adj) 19.88% 15- : 10- -0.5 0.0 1.5 Ⓡ S 5.26270 Coefficients Term Coef VIF SE Coef 2.26 T-Value 2.88 P-Value 0.0164 Constant 6.512 BMI change 5.472 2.83 1.93 0.0823 1.00 Regression Equation Depression score change = 6.512 + 5.472 BMI change (a) What percentage of observed variation in depression score change can be explained by the simple linear regression model? (Round your answer to…arrow_forwardA paper gives data on x = change in Body Mass Index (BMI, in kilograms/meter) and y = change in a measure of depression for patients suffering from depression who participated in a pulmonary rehabilitation program. The table below contains a subset of the data given in the paper and are approximate values read from a scatterplot in the paper. BMI Change (kg/m²) -0.5 0.7 0.5 0.1 0.8 1 1.5 1.2 1 0.4 0.4 Depression Score Change -1 4 4 8 13 14 16 18 12 14 The accompanying computer output is from Minitab. Fitted Line Plot Depression score change = 6.598 + 5.327 BMI change 20- 5.10254 R-Sq R-Sq (adj) 20.06% 27.32% 15- 10- 5- 0- -0.5 0.0 0.5 1.0 1.5 BMI change R-sq 5.10254 27.32% Coefficients Term Coef SE Coef T-Value P-Value VIF Constant 6.598 2.19 3.01 0.0132 BMI change 5.327 2.75 1.94 0.0812 1.00 Regression Equation Depression score change = 6.598 + 5.327 BMI change (a) What percentage of observed variation in depression score change can be explained by the simple linear regression model?…arrow_forward
- Ocean currents are important in studies of climate change, as well as ecology studies of dispersal of plankton. Drift bottles are used to study ocean currents in the Pacific near Hawaii, the Solomon Islands, New Guinea, and other islands. Let x represent the number of days to recovery of a drift bottle after release and y represent the distance from point of release to point of recovery in km/100. The following data are representative of one study using drift bottles to study ocean currents. Σx = 476, Σy = 87.1, Σx2 = 62,290, Σy2 = 2046.87, Σxy = 11121.3,and r ≈ 0.94367. x days 72 76 32 91 205y km/100 14.7 19.6 5.3 11.7 35.8 a) Use a 1% level of significance to test the claim ? > 0.(Use 2 decimal places.)t =critical t= b) Find the predicted distance (km/100) when a drift bottle has been floating for 60 days. (Use 2 decimal places.)________ km/100 c) Find a 90% confidence interval for your prediction of part (d). (Use 1 decimal place.)lower limit = _____…arrow_forwardConsider the following linear regression model: Y = Ba + Bzu + B,1n + ByTu + 4 (i) Derive the normal equations using OLS method. (ii) Show that E () = 0 using the normal eqn.s derived in part i.arrow_forwardSuppose that the weight of a type of organism is governed by a power law relationship with its length from snout to tail and the thickness of its central vertebrae W = cLpVq. One specimen weighed 37 kg with a length of 1.6 m and vertebral thickness 1 cm. A second specimen weighed 45 kg with a length of 1.6 m and vertebral thickness 1.3 cm. A third specimen weighed 56 kg with a length of 3.1 m and vertebral thickness 1.2 cm. Write an equation with the correct coefficient and parameters values.arrow_forward
 Algebra & Trigonometry with Analytic GeometryAlgebraISBN:9781133382119Author:SwokowskiPublisher:Cengage