Concept explainers
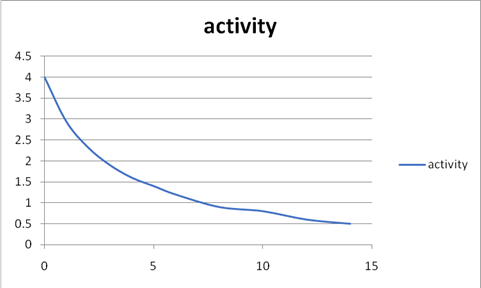
The equation for the retention curve as a function of time and the plot of the retention data.
Answer to Problem 6.19P
Explanation of Solution
Given:
The below data has been given to plot the graph.

Formula used:
Calculation:
The plot of retention data.
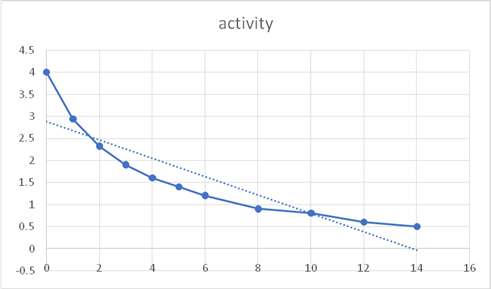
The slope of the line.
The half-time for this short-lived component is 1.1 days, and the slope is 0.69311.1 days = 0.63 per day. The equation for the short-lived component is:
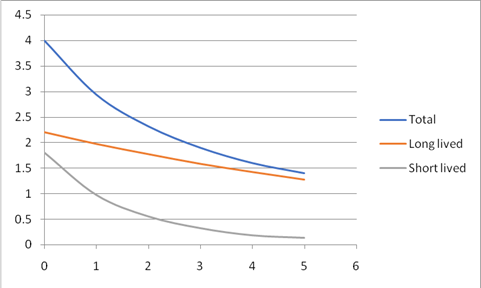
| Day | Total | Long lived | Short lived |
| 0 | 4 | 2.2 | 1.8 |
| 1 | 2.94 | 1.97 | 0.97 |
| 2 | 2.32 | 1.77 | 0.55 |
| 3 | 1.9 | 1.58 | 0.32 |
| 4 | 1.6 | 1.42 | 0.18 |
| 5 | 1.4 | 1.27 | 0.13 |
Conclusion:
(b)
The absorbed dose to the patient at day 7 and day 14 after administration of the drug.
(b)
Answer to Problem 6.19P
Explanation of Solution
Given:
Formula used:
Calculation:
Assumptions: The 14C to be uniformly distributed throughout the body.
The absorbed dose to the patient at day 7 and day 14 after administration of the drug.
Find dose rate:
Absorbed dose to the patient after 7 days.
Calculating the dose after 14 days in a similar fashion.
Conclusion:
(c)
The dose commitment from the procedure.
(c)
Answer to Problem 6.19P
Explanation of Solution
Given:
Formula used:
Calculation:
Conclusion:
Want to see more full solutions like this?
Chapter 6 Solutions
Introduction To Health Physics


- If the output is 24 mR / hour at 40 mAs, at 40 inches, what would the dose be per hour for 20 mAs (give answer in R)?arrow_forwardIf the dose rate from a sample of Ra-223 was found to be 5.0 x 10⁻⁵ mSv per hour at 1.8 metres, calculate the dose rate at 4.8 metres. Show your calculations. Give your answer to two significant figures.arrow_forwardFrom the average of these values, determine the maximum number of hours you could work with this material in a year if the annual maximum permissible dose is 2.4 mSv and you count with 200 working days in a yeararrow_forward
- What is the dose in mSv for 1.5 mGy of α exposure?arrow_forwardc) A patient has a CT scan of their abdomen with an absorbed dose of 25.0 mSv. The scan ends near the top of their pelvis. Assume that 15% of their bone is scanned, 20% of their skin, 90% of their colon, 25% of their bladder and 10% of their lungs but none of their liver, stomach, and gonads. A further 20% of tissue characterised as 'remainder of the body' is also exposed during the scan. The tissue weighting factors for various organs is listed in the table below: Tissue weighting Tissue Tissue weighting factor factor skin 0.01 oesophagus 0.04 bone marrow 0.12 bladder 0.04 bone surface 0.01 breast 0.12 brain 0.01 gonads 0.08 0.12 thyroid 0.04 0.04 salivary glands 0.01 remainder of body 0.12 stomach 0.12 colon 0.12 Tissue lung liver What is the overall effective dose received by the patient from the CT scan?arrow_forwardEstimate the exposure rate 2 m from 4 Ci sources of 57Co,22Na,65Zn?Exposure Rate constant for 57Co=0.9 (R.cm2) / (hr.mCi)Exposure Rate constant for 22Na =12 (R.cm2) / (hr.mCi)Exposure Rate constant for 65Zn =2.7 (R.cm2) / (hr.mCi)arrow_forward
- A worker will need to conduct a repair to a pipe containing radioactive waste. The pipe is 10 m long, and the worker will need to be standing 50 cm from the pipe. A remote detector was used to take a reading of 1.5 R/hr at 3 m from the pipe. a) What is the dose rate at the work position? b) If the worker's dose limit is 30 rad, how long will he have to complete the work? Assume that there is no dose from approaching and leaving the work location.arrow_forward✓ ON "O 2.75 MeV 0.511 MeV 0.511 MeV B, E= 1.73 MeV Eave = 0.721 Mev O MeVarrow_forwardWhat is the exposure rate at 30 cm from a vial containing 20 mCi (740 MBq) of 131I?arrow_forward
- If the gamma-ray dose rate is 50 mSv hr-1 at a distance of 1.0 m from a source, what is the dose rate at a distance of 10 m from the source?arrow_forwardgiven 4hrs of 80dBA exposure ,2hrs of90 dBA exposure and 2hrs of 85 dBA exposure,what is the % dose? is this person overexposed to noisearrow_forwardEstimate how long a COVID-19 infected droplet will remain in the air when exhaled. Treat the droplet as a sphere of water with a 5 µm radius. Use the size and density of water to determine the mass of the sphere. Using a reasonable height, approximate the time the droplet will remain in the air.arrow_forward
 College PhysicsPhysicsISBN:9781305952300Author:Raymond A. Serway, Chris VuillePublisher:Cengage Learning
 University Physics (14th Edition)PhysicsISBN:9780133969290Author:Hugh D. Young, Roger A. FreedmanPublisher:PEARSON
 Introduction To Quantum MechanicsPhysicsISBN:9781107189638Author:Griffiths, David J., Schroeter, Darrell F.Publisher:Cambridge University Press
 Physics for Scientists and EngineersPhysicsISBN:9781337553278Author:Raymond A. Serway, John W. JewettPublisher:Cengage Learning
 Lecture- Tutorials for Introductory AstronomyPhysicsISBN:9780321820464Author:Edward E. Prather, Tim P. Slater, Jeff P. Adams, Gina BrissendenPublisher:Addison-Wesley
 College Physics: A Strategic Approach (4th Editio...PhysicsISBN:9780134609034Author:Randall D. Knight (Professor Emeritus), Brian Jones, Stuart FieldPublisher:PEARSON