
Videos
The general merchandise retail industry has a number of segments represented by the following companies:
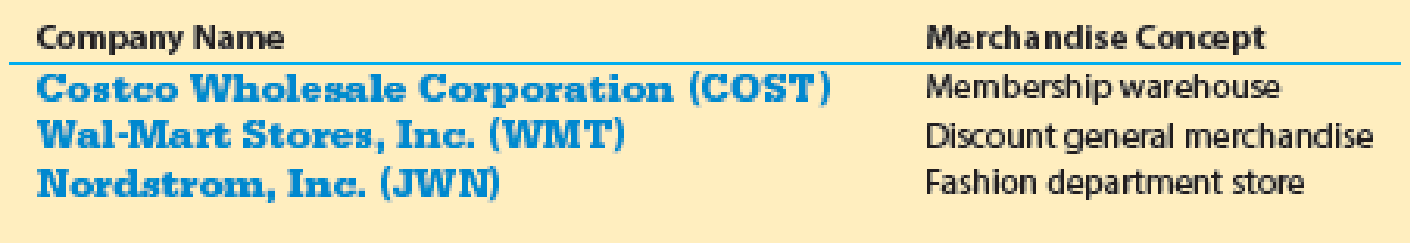
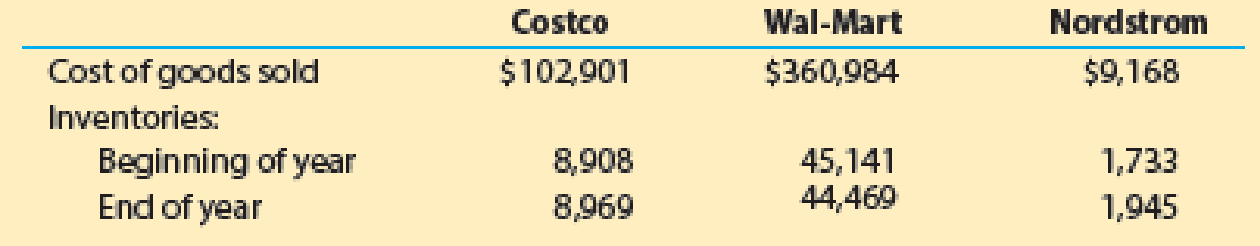
For a recent year, the following cost of goods sold and beginning and ending inventories are provided from corporate annual reports (in millions) for these three companies:
- a. Determine the inventory turnover ratio for all three companies. Round all calculations to one decimal place.
- b. Determine the number of days’ sales in inventory for all three companies. Use 365 days and round all calculations to one decimal place.
- c.
 Interpret these results based on each company’s merchandising concept.
(a)
Determine the inventory turnover for Company C, Company W and Company N.
Explanation of Solution
Inventory turnover ratio: Inventory turnover ratio is used to determine the number of times inventory used or sold during the particular accounting period. The formula to calculate the inventory turnover ratio is as follows:
The inventory turnover ratio for Company C is calculated is calculated as follows:
The inventory turnover ratio for Company W is calculated is calculated as follows:
The inventory turnover ratio for Company N is calculated is calculated as follows:
Working note (1):
The average inventory of Company C is calculated as follows:
Working note (2):
The average inventory of Company W is calculated as follows:
Working note (3):
The average inventory of Company N is calculated as follows:
The inventory turnover of Company C is 11.5 Times, the inventory turnover of Company W is 8.1 Times & the inventory turnover of Company N is 5.0 Times.
b.
Compute the number of days’ sales in inventory for Company C, Company W and Company N.
Explanation of Solution
Compute the number of days’ sales in inventory for Company C:
Thus, the number of days’ sales in inventory for Company C is 31.7 days.
Compute the number of days’ sales in inventory for Company W:
Thus, the number of days’ sales in inventory for Company W is 45.3 days.
Compute the number of days’ sales in inventory for Company N:
Thus, the number of days’ sales in inventory for Company N is 73.3 days.
The Days’ sales in inventory of Company C is 31.7 days, the Days’ sales in inventory of Company W is 45.3 days, & the Days’ sales in inventory of Company N is 73.3 days.
(c)
Interpret the above calculated ratios.
Explanation of Solution
The inventory turnover ratio and number of days’ sales in inventory of all the three companies reflect the merchandising approaches of all companies. Company C is a club warehouse and it has approach of holding only items which are quickly sold. Most of the items are sold in bulk at very attractive prices.
In case of company W, it has a traditional discounter approach. Even though it has attractive pricing, the inventory movement is slower than in the case of company C.
In the case of company N, it is a high-end fashioner retailer. It offers a wide collection of specialty and unique goods that are specifically designed for fashion market rather than for general mass market. Therefore, the movement is slower than other two companies yet it has highest margin.
Want to see more full solutions like this?
Chapter 6 Solutions
Financial And Managerial Accounting


- The following selected information is taken from the financial statements of Arnn Company for its most recent year of operations: During the year, Arnn had net sales of 2.45 million. The cost of goods sold was 1.3 million. Required: Note: Round all answers to two decimal places. 1. Compute the current ratio. 2. Compute the quick or acid-test ratio. 3. Compute the accounts receivable turnover ratio. 4. Compute the accounts receivable turnover in days. 5. Compute the inventory turnover ratio. 6. Compute the inventory turnover in days.arrow_forwardLast year, Nikkola Company had net sales of 2,299,500,000 and cost of goods sold of 1,755,000,000. Nikkola had the following balances: Refer to the information for Nikkola Company above. Required: Note: Round answers to one decimal place. 1. Calculate the average inventory. 2. Calculate the inventory turnover ratio. 3. Calculate the inventory turnover in days. 4. CONCEPTUAL CONNECTION Based on these ratios, does Nikkola appear to be performing well or poorly?arrow_forwardSundahl Companys income statements for the past 2 years are as follows: Refer to the information for Sundahl Company above. Required: 1. Prepare a common-size income statement for Year 1 by expressing each line item as a percentage of sales revenue. (Note: Round percentages to the nearest tenth of a percent.) 2. Prepare a common-size income statement for Year 2 by expressing each line item as a percentage of sales revenue. (Note: Round percentages to the nearest tenth of a percent.)arrow_forward
- Cuneo Companys income statements for the last 3 years are as follows: Refer to the information for Cuneo Company above. Required: 1. Prepare a common-size income statement for Year 1 by expressing each line item as a percentage of sales revenue. (Note: Round percentages to the nearest tenth of a percent.) 2. Prepare a common-size income statement for Year 2 by expressing each line item as a percentage of sales revenue. (Note: Round percentages to the nearest tenth of a percent.) 3. Prepare a common-size income statement for Year 3 by expressing each line item as a percentage of sales revenue. (Note: Round percentages to the nearest tenth of a percent.)arrow_forwardThe following data are taken from the general ledger and other records of Phoenix Products Co. on October 31, the end of the first month of operations in the current fiscal year: a. Prepare a statement of cost of goods manufactured. b. Prepare the cost of goods sold section of the income statement.arrow_forwardThe following revenue data were taken from the December 31, 2017, General Electric annual report (10-K): For each segment and each year, calculate intersegment sales (another name for transfer sales) as a percentage of total sales. Using Microsoft Excel or another spreadsheet application, create a clustered column graph to show the 2016 and 2017 percentages for each division. Comment on your observations of this data. How might a division sales manager use this data?arrow_forward
- Financial statement data for years ending December 31 for Holland Company follow: a. Determine the inventory turnover for 20Y4 and 20Y3. b. Determine the days sales in inventory for 20Y4 and 20Y3. Use 365 days and round to one decimal place. c. Does the change in inventory turnover and the days sales in inventory from 20Y3 to 20Y4 indicate a favorable or an unfavorable trend?arrow_forwardElephant, Inc.'s cost of goods sold for the year is $1,900,000, and the average merchandise inventory for the year is $132,000. Calculate the inventory turnover ratio of the company. (Round your answer to two decimal places.)arrow_forwardBroadway Communications reported the following figures in its annual financial statements: E (Click the icon to view the figures.) Compute the rate of inventory turnover and days' sales in inventory for Broadway Communications. (Round to two decimal places.) Select the labels and enter the amounts to compute the inventory turnover. (Enter the amount for average inventory to one decimal place, X.X. Round your answer two decimal places, X.XX.) Inventory turnover times Data Table Cost of Goods Sold 2$ 18,400 Beginning Merchandise Inventory 560 Ending Merchandise Inventory 450 Help Me Solve This Clear All Check Answer Print Done Type here to search 38°F 10/2 DELL prt se home end Insert %24 96 & 4 6 Q R Y D F H. K V alt pg up alt ctrlarrow_forward
- Financial And Managerial AccountingAccountingISBN:9781337902663Author:WARREN, Carl S.Publisher:Cengage Learning,
 Financial AccountingAccountingISBN:9781305088436Author:Carl Warren, Jim Reeve, Jonathan DuchacPublisher:Cengage Learning
 Financial AccountingAccountingISBN:9781337272124Author:Carl Warren, James M. Reeve, Jonathan DuchacPublisher:Cengage Learning
 Managerial AccountingAccountingISBN:9781337912020Author:Carl Warren, Ph.d. Cma William B. TaylerPublisher:South-Western College Pub
 Managerial Accounting: The Cornerstone of Busines...AccountingISBN:9781337115773Author:Maryanne M. Mowen, Don R. Hansen, Dan L. HeitgerPublisher:Cengage Learning