
Concept explainers
Videos
To find: The relationship, depicted by
Answer to Problem 1LC
Scatter plot of the data given is shown below:
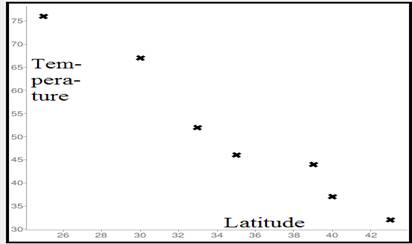
This graph shows that with the increase in values of latitude, the corresponding values of temperature are decreasing. So, such relation is a “
Explanation of Solution
Given information: The below table shows the data related to latitude and temperature.
| Latitude(M) | 35 | 33 | 30 | 25 | 43 | 40 | 39 |
| Temperature(F) | 46 | 52 | 67 | 76 | 32 | 37 | 44 |
Concept used: In XY coordinate plane, latitude is represented on horizontal x axis and temperature is represented on vertical y axis..
Calculation: Two data sets, on plotting in XY plane, show the related scattered plot as:
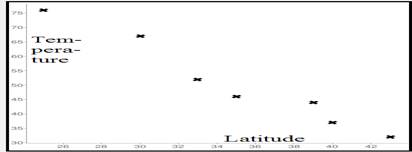
Conclusion: Scatter plot shows that as the values of latitude increase, the corresponding values of temperature decrease, so it is a negative
Chapter 5 Solutions
High School Math 2015 Common Core Algebra 1 Student Edition Grade 8/9
Additional Math Textbook Solutions
Graphical Approach To College Algebra
Elementary and Intermediate Algebra
College Algebra with Modeling & Visualization (5th Edition)
A Graphical Approach to College Algebra (6th Edition)
College Algebra in Context with Applications for the Managerial, Life, and Social Sciences (5th Edition)
Algebra and Trigonometry (6th Edition)


 Algebra and Trigonometry (6th Edition)AlgebraISBN:9780134463216Author:Robert F. BlitzerPublisher:PEARSON
 Contemporary Abstract AlgebraAlgebraISBN:9781305657960Author:Joseph GallianPublisher:Cengage Learning
 Linear Algebra: A Modern IntroductionAlgebraISBN:9781285463247Author:David PoolePublisher:Cengage Learning
 Algebra And Trigonometry (11th Edition)AlgebraISBN:9780135163078Author:Michael SullivanPublisher:PEARSON
 Introduction to Linear Algebra, Fifth EditionAlgebraISBN:9780980232776Author:Gilbert StrangPublisher:Wellesley-Cambridge Press
 College Algebra (Collegiate Math)AlgebraISBN:9780077836344Author:Julie Miller, Donna GerkenPublisher:McGraw-Hill Education