
Videos
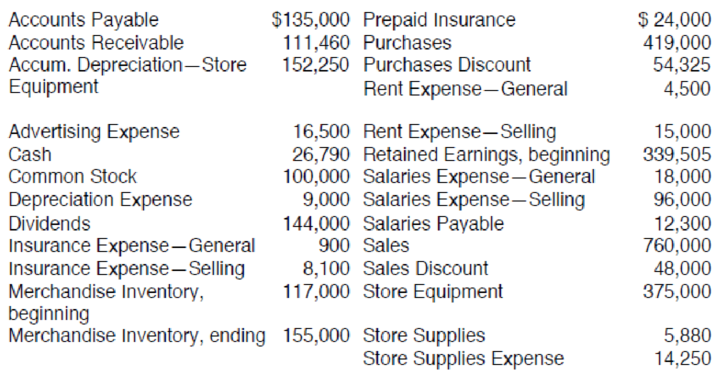
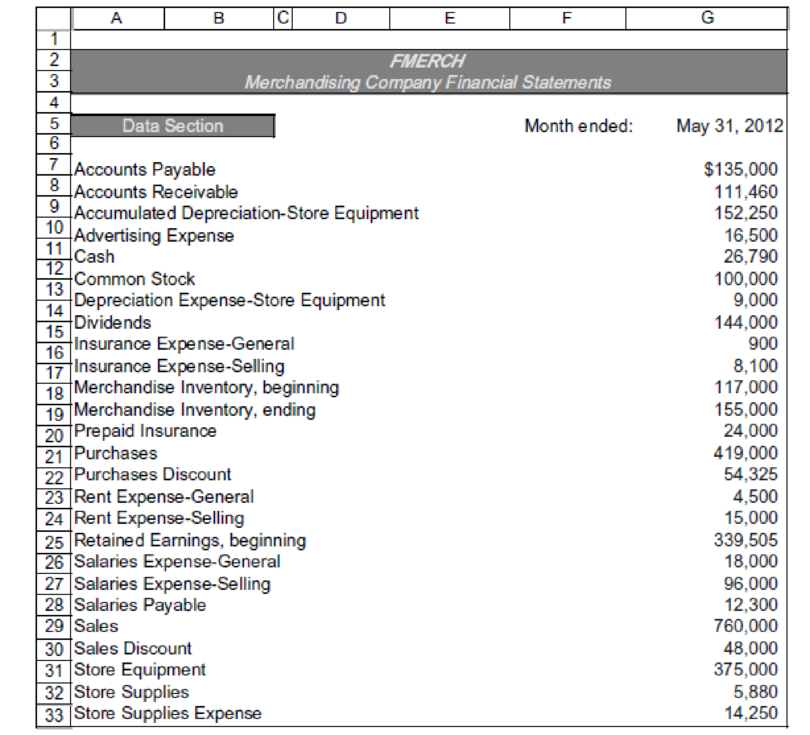
The following information is for Bonnieʼs Buds, a nursery and floral shop, for the month ended May 31, 2012:
Click the Chart sheet tab on the FMERCH3 file. You will see a chart depicting the five-month trend in sales, gross profit, and net income. What favorable and unfavorable trends do you see in this month-to-month comparison? Comment on any unusual changes. When the assignment is complete, close the file without saving it again.
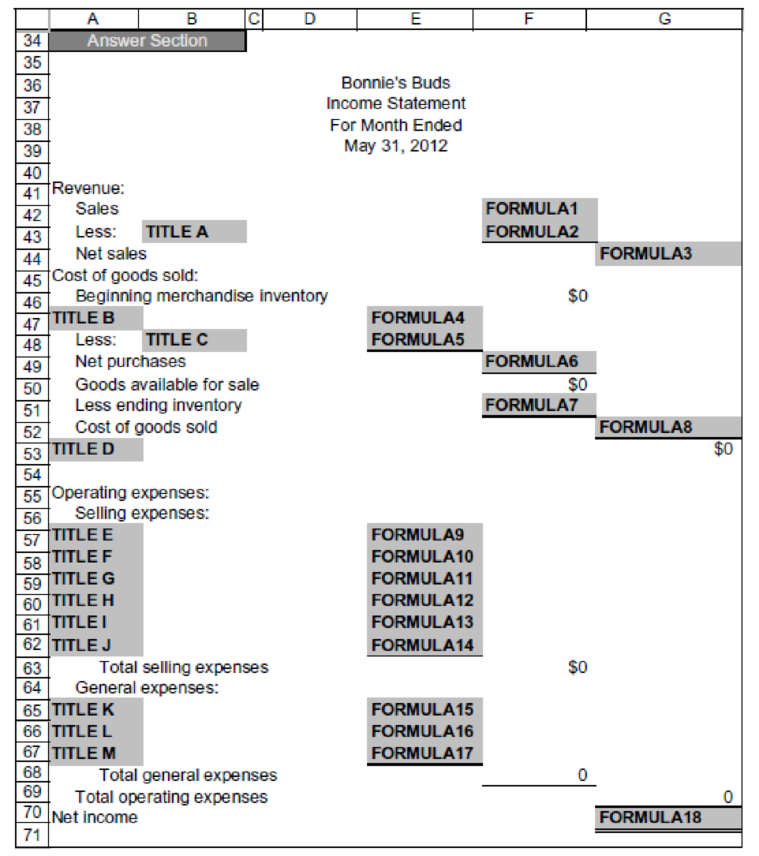
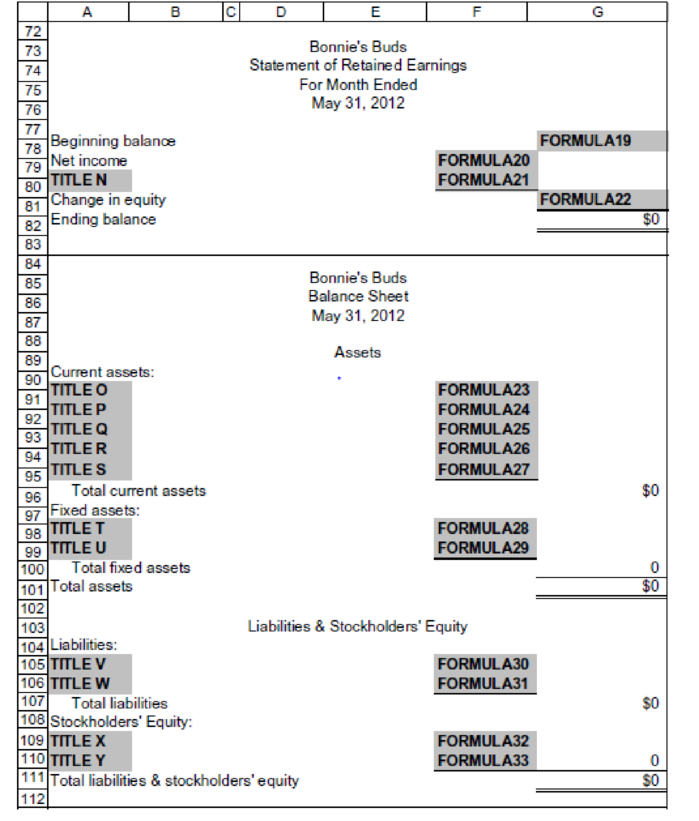
Worksheet. Your boss would prefer to have the
Chart. Using the FMERCH3 file, prepare a 3-D pie chart that shows the amount of each of the selling expenses in June. No Chart Data Table is needed. Select A57 to A62 as one range on the worksheet to be charted and then hold down the CTRL key and select E57 to E62 as the second range. Enter your name somewhere on the chart. Save the file again as FMERCH3. Select the chart and then print it out.
Want to see the full answer?
Check out a sample textbook solution
Chapter 4 Solutions
Excel Applications for Accounting Principles


- The following table provides monthly revenue values for Tedstar, Inc., a company that sells valves to large industrial firms. The monthly revenue data have been graphed using a line chart in the following figure. a. What are the problems with the layout and display of this line chart? b. Create a new line chart for the monthly revenue data at Tedstar, Inc. Format the chart to make it easy to read and interpret.arrow_forwardUse a spreadsheet and the following excerpts from Hileah Companys financial information to build a template that automatically calculates (A) inventory turnover and (B) number of days sales in inventory, for the year 2018.arrow_forwardThe following table shows monthly revenue for six different web development companies. a. Use Excel to create sparklines for sales at each company. b. Which companies have generally decreasing revenues over the six months? Which company has exhibited the most consistent growth over the six months? Which companies have revenues that are both increasing and decreasing over the six months? c. Use Excel to create a heat map for the revenue of the six companies. Do you find the heat map or the sparklines to be better at communicating the trend of revenues over the six months for each company? Why?arrow_forward
- ABC is an online-to-offline platform that sells e-commerce products to offline customers through a network of agents. ABC gives a commission to agents for each sale made. ABC has 4 main product categories: electronics, fashion, supermarket, and others. Please refer to the exhibits for data sets pertaining to the questions below. Today is May 16th. What is the average growth in average sales per agent per month from March to May target? Answer:..... % Which one is the category with the highest and lowest average month-on-month sales growth from March to May target? Answer: Highest : .......... Lowest:............. Today is 16th May We have got the interim result of the sales figures in the first half of May. Typically, the first half of the month constitutes of 40% of sales. Using this assumption, will we reach our May target? What % over the target will we over/under-deliver? Answer: under/over-deliver by ......... % of target Using that assumption, which…arrow_forwardThe following is the adjusted trial balance data for Nino’s Pizzeria as of December 31, 2019. Use the data provided to compute net sales for 2019. Compute the gross margin for 2019. Compute the gross profit margin ratio (rounded to nearest hundredth). Prepare a simple income statement for the year ended December 31, 2019. Prepare a multi-step income statement for the year ended December 31, 2019.arrow_forwardABC is an online-to-offline platform that sells e-commerce products to offline customers through a network of agents. ABC gives a commission to agents for each sale made. ABC has 4 main product categories: electronics, fashion, supermarket, and others. Please refer to the exhibits for data sets pertaining to the questions below. Today is May 16th. 1. What is the average growth in average sales per agent per month from March to May target? Answer: %2. Which one is the category with the highest and lowest average month-on- month sales growth from March to May target? Answer: Highest: Lowest:3. Today is May We have got the interim result of the sales figures in the first half of May. Typically, the first half of the month constitutes of 40% of sales. Using this assumption, will we reach our May target? What % over the target will we over/under-deliver? Answer: under/over-deliver by % of target4. Using that assumption, which category (or categories) will not reach the targeted sales…arrow_forward
- You will find the transactions within the spreadsheet. This additional information may be of use, as well. Additional Info (this mainly relates to adjustments - ie. Thinking) Because of the loan, you have to provide the bank with your financial statements at the end of the month - Feb 28, 2021. (we have to make proper FS including adjustments) You do a quick count of your inventory and find there are 19 pairs of shoes in inventory. On March 2nd, you receive a report from Shopify that states your credit card processing fees for the last month totalled $250. Shopify will remove the amount due from your future sales transactions. The March 2nd report also includes notice that your next $400 monthly fee will also simply reduce the amount received from future sales transactions. You think that your office furniture etc. will last for about 3 years. You do a quick check and find there's still about $370 worth of office and packing supplies left. In your wallet…arrow_forwardCustomer allowances and returnsAssume the following data for Lusk Inc. before its year-end adjustments: Journalize the adjusting entries for the following:a. Estimated customer allowancesb. Estimated customer returnsarrow_forwardUSE GOOGLE SHEET Use the template below and create your own invoice for purchased products of a VAT registered customer. The products are enumerated below with unit price at gross of VAT, a 3% discount has been given to the customer. Do all formulas required. Format the invoice for clarity.arrow_forward
- The following is selected information from Mars Corp. Compute net purchases, and cost of goods sold for the month of March. Record the journal entry or entries for each of the following sales transactions. Glow Industries sells 240 strobe lights at $40 per light to a customer on May 9. The cost to Glow is $23 per light. The terms of the sale are 5/15, n/40, invoice dated May 9. On May 13, the customer discovers 50 of the lights are the wrong color and are granted an allowance of $10 per light for the error. On May 21, the customer pays for the lights, less the allowance.arrow_forwardplease take below trial balance information for january 2020, conver it into financial statements. questions 1- make an income statement for this month 2- make a statement of equity for this month 3- make a balance sheet for this month 4- how many units and at what cost are in inventory to start the next month (february)?arrow_forwardAssume the following data for Casper Company before its year-end adjustments: Journalize the adjusting entries for the following:a. Estimated customer allowancesb. Estimated customer returnsarrow_forward
 Excel Applications for Accounting PrinciplesAccountingISBN:9781111581565Author:Gaylord N. SmithPublisher:Cengage Learning
 Principles of Accounting Volume 2AccountingISBN:9781947172609Author:OpenStaxPublisher:OpenStax College
 Essentials of Business Analytics (MindTap Course ...StatisticsISBN:9781305627734Author:Jeffrey D. Camm, James J. Cochran, Michael J. Fry, Jeffrey W. Ohlmann, David R. AndersonPublisher:Cengage Learning
 College Accounting (Book Only): A Career ApproachAccountingISBN:9781337280570Author:Scott, Cathy J.Publisher:South-Western College PubPrinciples of Accounting Volume 1AccountingISBN:9781947172685Author:OpenStaxPublisher:OpenStax College