
Concept explainers
Videos
To find:Type of
Answer to Problem 15PT
A
Explanation of Solution
Given information:The graph chows the relationship between outside temperature and daily ice cream cone sales.
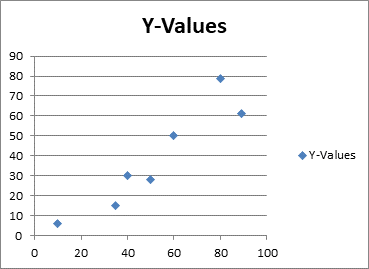
Where x -axis shows outside temperature and y -axis shows daily ice cream cone sale.
Calculation:
The graph shows a positive correlation. As the Temperature (F) increases, Ice Cream Cones sold increases .So, there is a positive correlation.
Chapter 4 Solutions
Glencoe Algebra 1, Student Edition, 9780079039897, 0079039898, 2018
Additional Math Textbook Solutions
Linear Algebra with Applications (9th Edition) (Featured Titles for Linear Algebra (Introductory))
Intermediate Algebra for College Students (7th Edition)
College Algebra
Algebra and Trigonometry
Linear Algebra with Applications (2-Download)
College Algebra (10th Edition)


 Algebra and Trigonometry (6th Edition)AlgebraISBN:9780134463216Author:Robert F. BlitzerPublisher:PEARSON
 Contemporary Abstract AlgebraAlgebraISBN:9781305657960Author:Joseph GallianPublisher:Cengage Learning
 Linear Algebra: A Modern IntroductionAlgebraISBN:9781285463247Author:David PoolePublisher:Cengage Learning
 Algebra And Trigonometry (11th Edition)AlgebraISBN:9780135163078Author:Michael SullivanPublisher:PEARSON
 Introduction to Linear Algebra, Fifth EditionAlgebraISBN:9780980232776Author:Gilbert StrangPublisher:Wellesley-Cambridge Press
 College Algebra (Collegiate Math)AlgebraISBN:9780077836344Author:Julie Miller, Donna GerkenPublisher:McGraw-Hill Education