
Videos
Use following formation for P4-15 and P4-16:
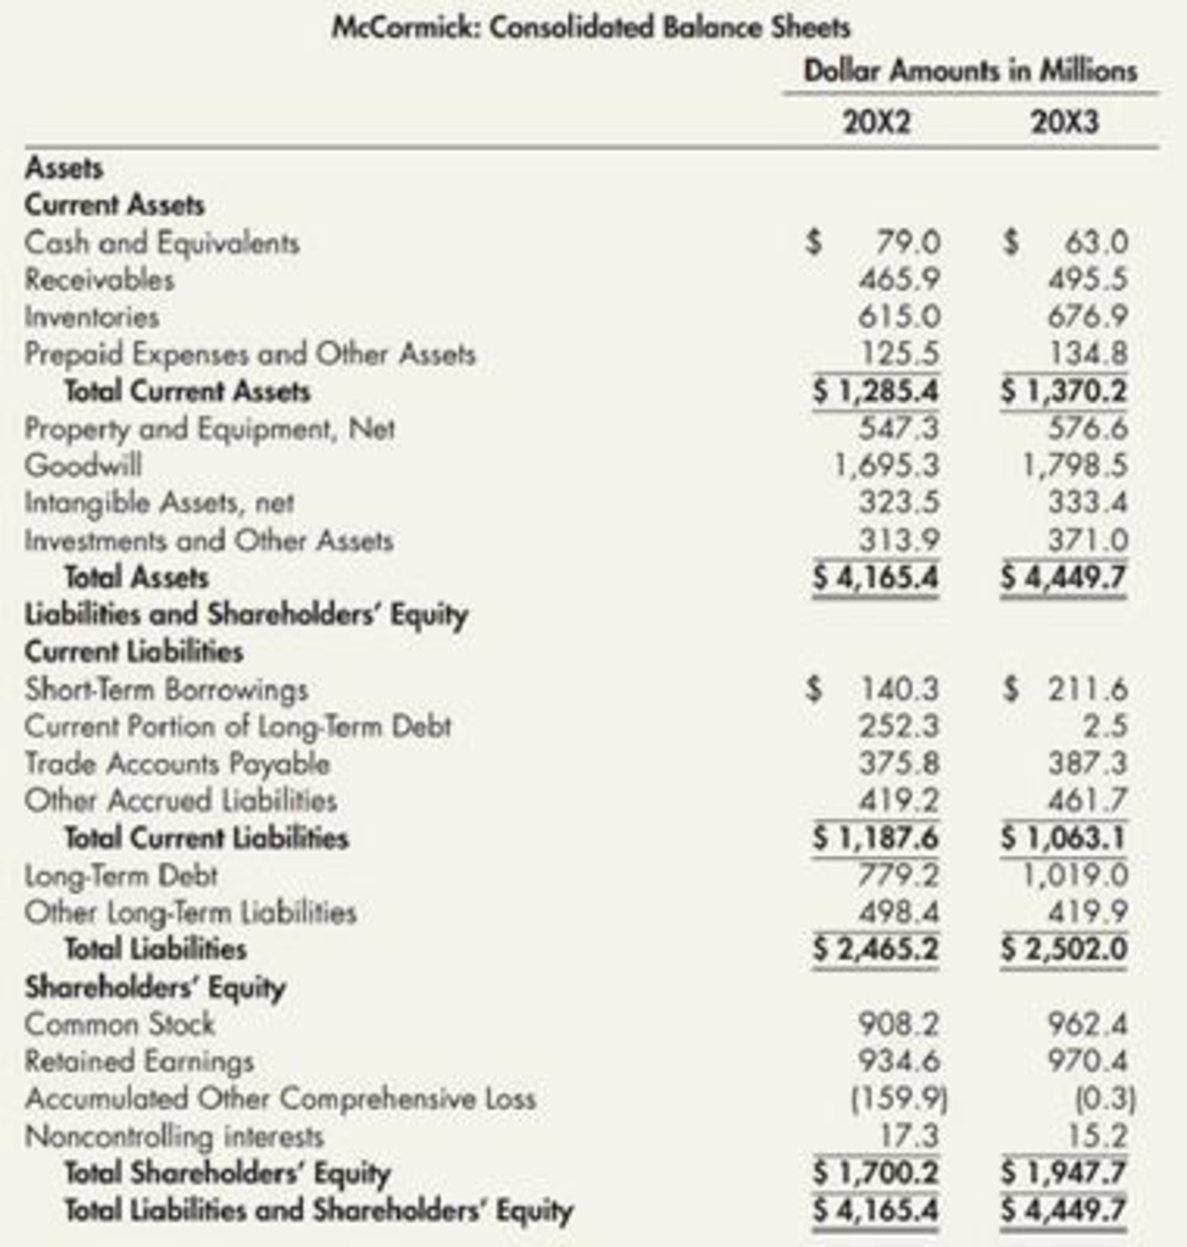
McCormick & Company, Inc. is one of the world’s leading producers of spices, herbs, seasonings, condiments, and other flavorings for foods. Its products are sold to consumers, with some of the leading brands of spices and seasonings, as well as to industrial producers of foods. McCormick’s consolidated balance sheets for 20X2 and 20X3 follow.
Common-Size and Rate of Change Analyses: McCormick Refer to the information for McCormick above.
Required:
Compute the common size balance sheet for 20X3 and the rate of change balance sheet for 20X3. Which two asset accounts and which two liabilities and shareholders’ equity accounts are the largest relative to total assets in 20X3? Which two asset accounts and which two liability and shareholders’ equity accounts grew at the fastest rates in 20X3? (Note: You may find it helpful to enter the data into an Excel spreadsheet for these computations.)

Trending nowThis is a popular solution!

Chapter 4 Solutions
Intermediate Accounting: Reporting And Analysis


- Use the following information for P417 and P418: The Hershey Company is one of the worlds leading producers of chocolates, candies, and confections. It sells chocolates and candies, mints and gums, baking ingredients, toppings, and beverages. Hersheys consolidated balance sheets for 20X2 and 20X3 follow. Ratios Analysis: Hershey Refer to the information for Hershey On the preceding page. Additional information for 20X3 is as follows (amounts in millions): Required: Next Level Compute the following ratios for 20X3. Provide a brief description of what each ratio reveals about Hershey. 1. return on common equity 2. debt-to-assets 3. debt-to-equity 4. current 5. quick (Hershey uses cash and equivalents, short terms securities, and receivables in their quick ratio calculation.) 6. inventory turnover days 7. accounts receivable turnover days 8. accounts payable turnover days 9. operating cycle (in days) 10. total asset turnoverarrow_forwardCarson Electronics’ management has long viewed BGT Electronics as an industry leader and uses this firm as a model firm for analyzing its own performance. The balance sheet and income statements for the two firms are as follows: Calculate the following ratios for both Carson and BGT: a) Current ratio: b) Times interest earned: c) Inventory turnover:arrow_forwardSuppose you want to compare Palfinger AG to another heavy equipment manufacture, Caterpillar, Inc. To compare the companies, complete the table below and calculate common-sized numbers. To common-size balance sheet numbers, divide by total assets abd to common-size income statement numbers, divide by net sales. Comment on the trends over time and levels across companies.arrow_forward
- A) explain the following questions after reading the passage about MAERSK. A.P. Moller - Maersk is an integrated transport & logistics company with multiple brands and is a global leader in container shipping and ports. Including a stand-alone Energy division, the company employs roughly 80.000 employees across operations in 130 countries. In addition to owning one of the world’s largest shipping companies, Maersk is involved in a wide range of activities in the shipping, logistics, and the oil and gas industries. So The Maersk Group operates within global trade, shipping and energy industries and provides innovative marketing solutions that will help not only its companies advance, but the overall industries as well.Transport & Logistics consists of Maersk Line, APM Terminals, Damco, Svitzer and MaerskContainer Industry. The mission of these businesses is to enable and facilitate global supply chains and provide opportunities for our customers to trade globally. Soren Skou,…arrow_forwardA corporation is considering the acquisition of one of its parts suppliers and has been reviewing the pertinent financial statements. Specific data, shown below, has been selected from these statements for review and comparison with industry averages. B R W Industry Total sales (millions) $4.27 $3.91 $4.86 $4.30 Net profit margin 9.55% 9.85% 10.05% 9.65% Current ratio 1.32 2.02 1.96 1.95 Return on assets 11.0% 12.6% 11.4% 12.4% Debt/equity ratio 62.5% 44.6% 49.6% 48.3% Financial leverage 1.40 1.02 1.86 1.33 The objective for this acquisition is assuring a steady source of supply from a stable company. Based on the information above, select the strategy that would fulfill the objective. A. The corporation should not acquire any of these firms as none of them represents a good risk. B. Acquire B as both the debt/equity ratio and degree of financial…arrow_forwardEcru Company has identified five industry segments: plastics, metals, lumber, paper, and finance. It appropriately consolidated each of these segments in producing its annual financial statements. Information describing each segment (in thousands) follows: Plastics Metals Lumber Paper Finance Sales to outside parties $ 6,325 $ 2,144 $ 636 $ 347 $ 0 Intersegment transfers 108 131 96 108 0 Interest income from outside parties 0 19 6 0 27 Interest income from intersegment loans 0 0 0 0 159 Operating expenses 3,914 1,612 916 579 16 Interest expense 61 16 51 31 87 Tangible assets 1,291 2,986 314 561 104 Intangible assets 72 361 0 48 0 Intersegment loans (debt) 0 0 0 0 664 Ecru does not allocate its $1,250,000 in…arrow_forward
- AGF Foods Company is a large, primarily domestic, consumer foods company Involved in the manufacture, distribution, and sale of a variety of food products. Industry averages are derived from Troy's The Almanac of Business and Industrial Financial Ratios and Dun and Bradstreet's Industry Norms and Key Business Ratios. Following are the 2024 and 2023 comparative Income statements and balance sheets for AGF. The market price of AGF's common stock is $47 at the end of 2024. (The financial data we use are from actual financial statements of a well-known corporation, but the company name used in our illustration is fictitious and the numbers and dates have been modified slightly to disguise the company's Identity:) Profitability is the key to a company's long-run survival. Profitability measures focus on a company's ability to provide an adequate return relative to resources devoted to company operations. ($ in millions) AGF FOODS COMPANY Years Ended December 31, 2024 and 2023 2024…arrow_forwardAGF Foods Company is a large, primarily domestic, consumer foods company involved in the manufacture, distribution, and sale of a variety of food products. Industry averages are derived from Troy's The Almanac of Business and Industrial Financial Ratios and Dun and Bradstreet's Industry Norms and Key Business Ratios. Following are the 2024 and 2023 comparative income statements and balance sheets for AGF. The market price of AGF's common stock is $47 at the end of 2024. (The financial data we use are from actual financial statements of a well-known corporation, but the company name used in our illustration is fictitious and the numbers and dates have been modified slightly to disguise the company's identity.) Profitability is the key to a company's long-run survival. Profitability measures focus on a company's ability to provide an adequate return relative to resources devoted to company operations. AGF FOODS COMPANY Years Ended December 31, 2024 and 2023 2024 Comparative Income…arrow_forwardChevalier Company has identified five industry segments: plastics, metals, lumber, paper, and finance. It appropriately consolidated each of these segments in producing its annual financial statements. Information describing each segment (in thousands) follows: Accounts Sales to outside parties Intersegment sales Interest income from outside parties Interest income from intersegment loans Operating expenses Interest expense Tangible assets Intangible assets Intersegment loans (debt) Plastics $ 6,694 Metals $ 2,354 Lumber $ 711 148 173 138 Paper $ 422 150 Finance $ 0 0 0 34 21 0 42 0 0 0 0 201 4,214 76 1,762 1,066 654 31 31 66 28 102 1,501 87 3,196 524 771 179 0 403 0 0 63 0 0 0 706 Chevalier does not allocate its $1,460,000 in common expenses to the various segments. Required: a1. Perform revenue test procedure to determine Chevalier's reportable operating segments. a2. Perform profit or loss test procedure to determine Chevalier's reportable operating segments. a3. Perform asset test…arrow_forward
- Ratios Analysis: Hershey The Hershey Company is one of the world's leading producers of chocolates, candies, and confections. It sells chocolates and candies, mints and gums, baking ingredients, toppings, and beverages. Hershey's consolidated balance sheets for 20X2 and 20X3 follow. Hershey: Consolidated Balance Sheets Dollar Amounts in Millions 20X2 20X3 Assets Current Assets Cash and Equivalents $728.3 $1,118.5 Receivables 461.4 477.9 Inventories 633.3 659.5 Deferred Income Taxes 122.2 52.5 Prepaid Expenses and Other Assets 168.3 178.9 Total Current Assets $2,113.5 $2,487.3 Property, Plant and Equipment, Net 1,674.1 1,805.3 Goodwill 588.0 576.6 Other Intangible Assets, net 214.7 195.2 Other Assets 164.5 293.0 Total Assets $4,754.8 $5,357.5 Liabilities and Shareholders' Equity Current Liabilities Accounts Payable $442.0 $461.5 Accrued Liabilities 650.9 699.7 Accrued Income Taxes 2.3 79.9…arrow_forwardPresented below is an excerpt from the financial statements of H. J. Heinz Company. Segment and Geographic Data The company is engaged principally in one line of business—processed food products—which represents over 90% of consolidated sales. Information about the business of the companyby geographic area is presented in the table below. There were no material amounts of sales or transfers between geographic areas or betweenaffiliates, and no material amounts of United States export sales. Foreign (in thousands ofU.S. dollars) Domestic UnitedKingdom Canada WesternEurope Other Total Worldwide Sales $2,381,054 $547,527 $216,726 $383,784 $209,354 $1,357,391 $3,738,445 Operating income 246,780 61,282 34,146 29,146 25,111 149,685 396,465 Identifiable assets 1,362,152 265,218 112,620 294,732 143,971 816,541 2,178,693 Capital expenditures 72,712 12,262 13,790 8,253 4,368 38,673 111,385 Depreciation expense 42,279 8,364 3,592 6,355 3,606 21,917 64,196…arrow_forwardGF Foods Company is a large, primarily domestic, consumer foods company involved in the manufacture, distribution, and sale of a variety of food products. Industry averages are derived from Troy’s The Almanac of Business and Industrial Financial Ratios. Following are the 2024 and 2023 comparative balance sheets for IGF. (The financial data we use are from actual financial statements of a well-known corporation, but the company name used is fictitious, and the numbers and dates have been modified slightly.) IGF FOODS COMPANY Comparative Balance Sheets Years Ended December 31, 2024 and 2023 ($ in millions) 2024 2023 Assets Current assets: Cash $ 48 $ 142 Accounts receivable 347 320 Marketable securities 358 – Inventories 914 874 Prepaid expenses 212 154 Total current assets $ 1,879 $ 1,490 Property, plant, and equipment (net) 2,592 2,291 Intangibles (net) 800 843 Other assets 74 60 Total assets $ 5,345 $ 4,684 Liabilities and Shareholders’…arrow_forward
- Intermediate Accounting: Reporting And AnalysisAccountingISBN:9781337788281Author:James M. Wahlen, Jefferson P. Jones, Donald PagachPublisher:Cengage Learning
 Financial And Managerial AccountingAccountingISBN:9781337902663Author:WARREN, Carl S.Publisher:Cengage Learning,
 Managerial AccountingAccountingISBN:9781337912020Author:Carl Warren, Ph.d. Cma William B. TaylerPublisher:South-Western College Pub
  Financial Reporting, Financial Statement Analysis...FinanceISBN:9781285190907Author:James M. Wahlen, Stephen P. Baginski, Mark BradshawPublisher:Cengage Learning