
A
The impact on the cigarette market when the remedy for lung cancer is discovered.
Concept Introduction:
Demand curve: The demand curve is the graphical representation of the relationship between the price of a good or service and the quantity demanded for a given period of time. The X (vertical) axis represents the price and quantity demanded in the Y (horizontal) axis.
Supply curve: The supply curve is the graphical representation of the relationship between the price of a good or service and the quantity supplied for a given period of time. The X (vertical) axis represents the price and quantity supplied in the Y (horizontal) axis.
A
Explanation of Solution
- A cure for lung cancer is found
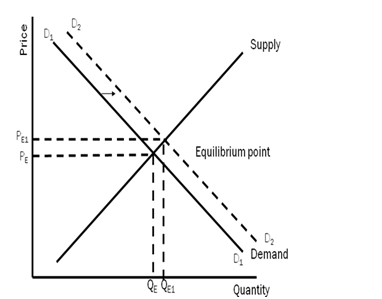
Other things remaining the same, after the cure for lung cancer is found, the fear of getting non-curable cancer in the mind of the smokers will no longer exist. Now they will become fearless and the smoking might increase. The demand for cigarettes will increase. There will be a rightward shift in the demand curve from D1 to D2, supply remaining same at S1.
B
The impact on the cigarette market when there is a rise in the price of cigars.
Concept Introduction:
Demand curve: The demand curve is the graphical representation of the relationship between the price of a good or service and the quantity demanded for a given period of time. The X (vertical) axis represents the price and quantity demanded in the Y (horizontal) axis.
Supply curve: The supply curve is the graphical representation of the relationship between the price of a good or service and the quantity supplied for a given period of time. The X (vertical) axis represents the price and quantity supplied in the Y (horizontal) axis.
B
Explanation of Solution
The price of Cigars increases
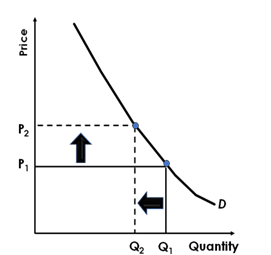
Other things remaining the same, as the price of the cigarette will increase, the demand for the cigarette will decrease as per the demand law. But as the cigarette is all about addiction, the demand is more inelastic. So the demand will fall but at a much lower rate as compared to the price.
C
The impact on the cigarette market when the wages in the tobacco growing states increases.
C
Explanation of Solution
Wages increases substantially in the states that grow tobacco.
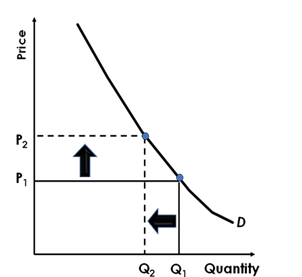
Other things remaining the same, as the wages for growing tobacco has increased, it implies that the cost of production of producing cigarettes has increased. Thus the price of cigarette will increase; the demand for the cigarette will decrease as per the demand law. But as the cigarette is all about addiction, the demand is more inelastic. So the demand will fall but at a much lower rate as compared to the price.
Introduction:
Demand curve: The demand curve is the graphical representation of the relationship between the price of a good or service and the quantity demanded for a given period of time. The X (vertical) axis represents the price and quantity demanded in the Y (horizontal) axis.
Supply curve: The supply curve is the graphical representation of the relationship between the price of a good or service and the quantity supplied for a given period of time. The X (vertical) axis represents the price and quantity supplied in the Y (horizontal) axis.
D
The impact on the cigarette market with the discovery of a fertilizer that increases the yield per acre of tobacco.
D
Explanation of Solution
A fertilizer that increases the yield per acre of tobacco is discovered
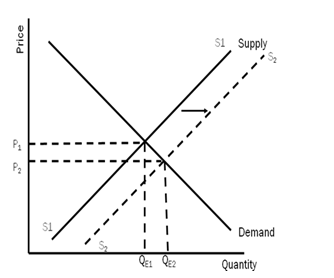
Other things remaining the same, as the fertilizer that increases the yield per acre of tobacco is discovered, it implies that the supply of tobacco will be more, and thus the supply of cigarette will increase. There will be a rightward shift in the supply curve from S1 to S2, supply remaining same at D1.
Introduction:
Demand curve: The demand curve is the graphical representation of the relationship between the price of a good or service and the quantity demanded for a given period of time. The X (vertical) axis represents the price and quantity demanded in the Y (horizontal) axis.
Supply curve: The supply curve is the graphical representation of the relationship between the price of a good or service and the quantity supplied for a given period of time. The X (vertical) axis represents the price and quantity supplied in the Y (horizontal) axis.
E
The impact on the cigarette market with an increase in the prices of lighters, matches and lighter fluid.
E
Explanation of Solution
There is a sharp increase in the price of matches, lighters and lighter fluid
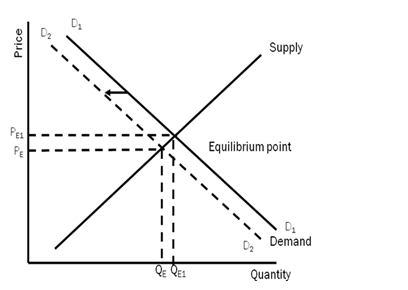
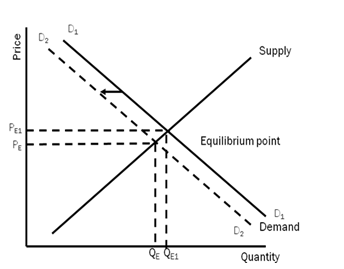
Other things remaining the same, as there is a sharp increase in the price of matches, lighters and lighter fluid, it implies that the demand of cigarette will be less, as the complementary goods price has increased There will be a leftward shift in the demand curve from D1 to D2, supply remaining same at S1.
Introduction:
Demand curve: The demand curve is the graphical representation of the relationship between the price of a good or service and the quantity demanded for a given period of time. The X (vertical) axis represents the price and quantity demanded in the Y (horizontal) axis.
Supply curve: The supply curve is the graphical representation of the relationship between the price of a good or service and the quantity supplied for a given period of time. The X (vertical) axis represents the price and quantity supplied in the Y (horizontal) axis.
F
The impact on the cigarette market when the laws restricting smoking in public places and restaurants have been passed in many states.
F
Explanation of Solution
More states pass laws restricting the smoking in restaurants and public places.
Other things remaining the same, as more states pass laws restricting the smoking in restaurants and public places, implies restriction in smoking. It will lead to decreases in the demand of cigarette. There will be a leftward shift in the demand curve from D1 to D2, supply remaining same at S1.
Introduction:
Demand curve: The demand curve is the graphical representation of the relationship between the price of a good or service and the quantity demanded for a given period of time. The X (vertical) axis represents the price and quantity demanded in the Y (horizontal) axis.
Supply curve: The supply curve is the graphical representation of the relationship between the price of a good or service and the quantity supplied for a given period of time. The X (vertical) axis represents the price and quantity supplied in the Y (horizontal) axis.
Want to see more full solutions like this?


