Videos
Logistic growth Scientists often use the logistic growth function
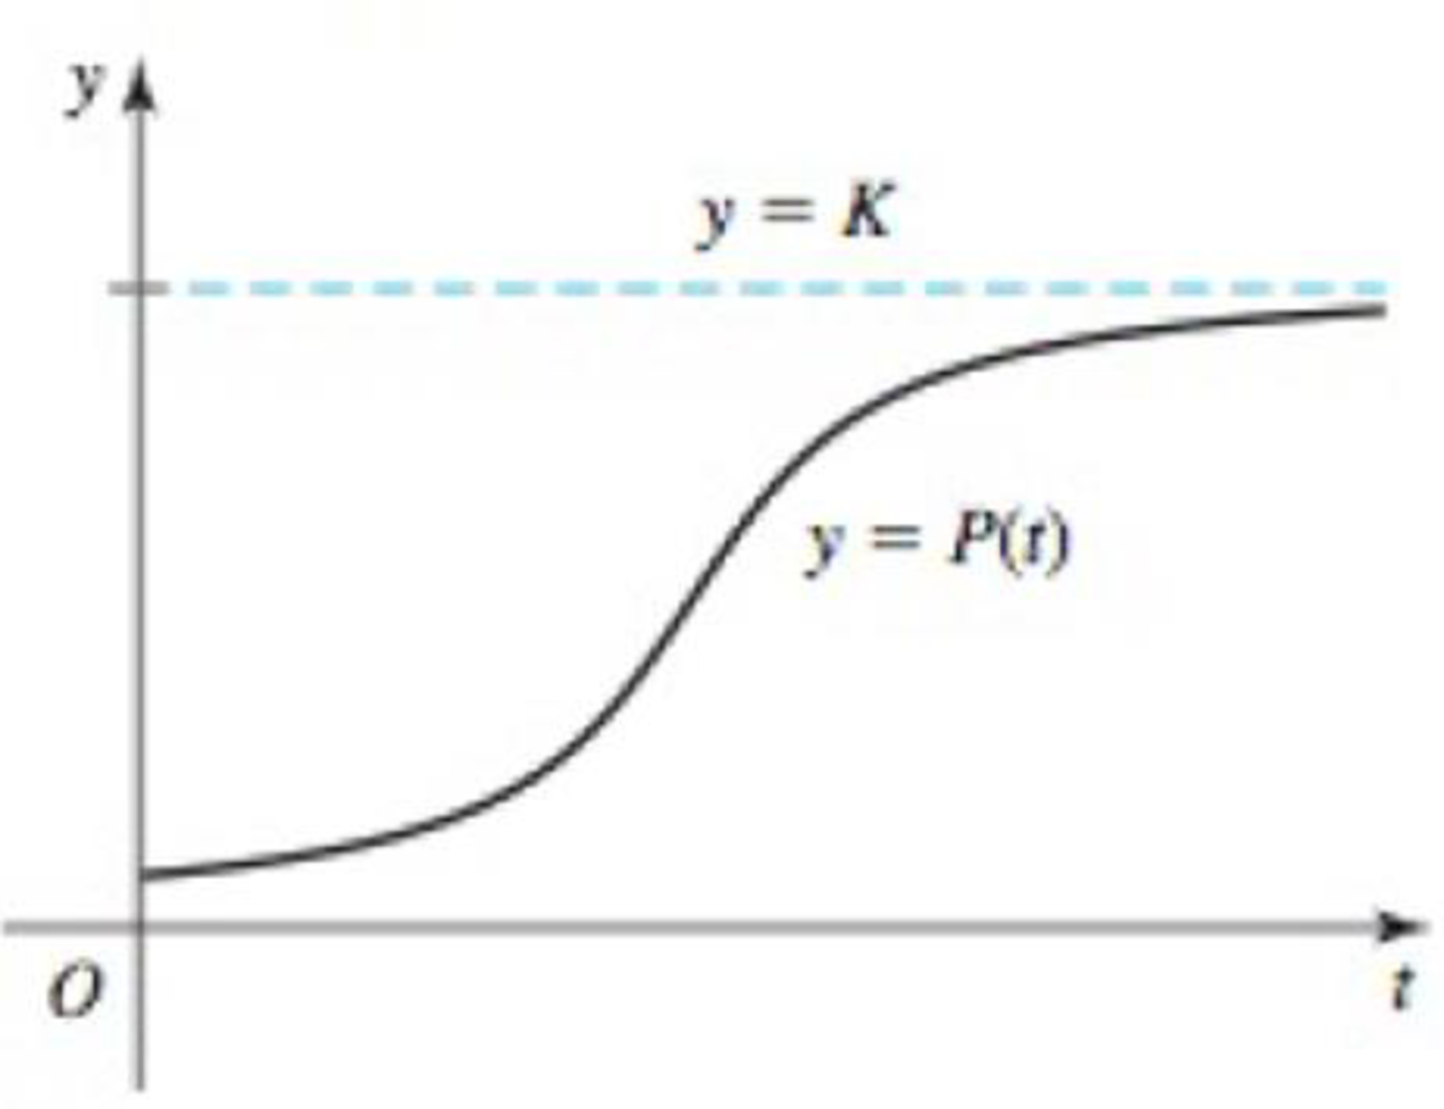
96. Population crash The logistic model can be used for situations in which the initial population P0 is above the carrying capacity K. For example, consider a deer population of 1500 on an island where a fire has reduced the carrying capacity to 1000 deer.
- a. Assuming a base growth rate of r0 = 0.1 and an initial population of P(0) = 1500, write a logistic growth function for the deer population and graph it. Based on the graph, what happens to the deer population in the long run?
- b. How fast (in deer per year) is the population declining immediately after the fire at t = 0?
- c. How long does it take the deer population to decline to 1200 deer?
Want to see the full answer?
Check out a sample textbook solution
Chapter 3 Solutions
Calculus: Early Transcendentals (2nd Edition)
Additional Math Textbook Solutions
Precalculus (10th Edition)
Thomas' Calculus: Early Transcendentals (14th Edition)
Glencoe Math Accelerated, Student Edition
Precalculus Enhanced with Graphing Utilities (7th Edition)
University Calculus: Early Transcendentals (4th Edition)


- In the exponential growth or decay function y=y0ekt, what does y0 represent? What does k represent?arrow_forwardWhat is the carrying capacity for a population modeled by the logistic equation P(t)=250,0001+499e0.45t ? initial population for the model?arrow_forwardTable 6 shows the population, in thousands, of harbor seals in the Wadden Sea over the years 1997 to 2012. a. Let x represent time in years starting with x=0 for the year 1997. Let y represent the number of seals in thousands. Use logistic regression to fit a model to these data. b. Use the model to predict the seal population for the year 2020. c. To the nearest whole number, what is the limiting value of this model?arrow_forward
- The table shows the mid-year populations (in millions) of five countries in 2015 and the projected populations (in millions) for the year 2025. (a) Find the exponential growth or decay model y=aebt or y=aebt for the population of each country by letting t=15 correspond to 2015. Use the model to predict the population of each country in 2035. (b) You can see that the populations of the United States and the United Kingdom are growing at different rates. What constant in the equation y=aebt gives the growth rate? Discuss the relationship between the different growth rates and the magnitude of the constant.arrow_forwardSuppose that a particular plot of land can sustain 500 deer and that the population of this particular species of deer can be modeled according to the logistic model as dPdt=0.2(1P500)P. Each year, a proportion of the herd deer is sold to petting zoos. a. Find the function that gives the equilibrium population for various proportions. b. Determine the maximum number of deer that should be sold to petting zoos each year. Hint: Find the maximum sustainable harvestarrow_forward

 Calculus For The Life SciencesCalculusISBN:9780321964038Author:GREENWELL, Raymond N., RITCHEY, Nathan P., Lial, Margaret L.Publisher:Pearson Addison Wesley,
 Algebra & Trigonometry with Analytic GeometryAlgebraISBN:9781133382119Author:SwokowskiPublisher:Cengage
 Glencoe Algebra 1, Student Edition, 9780079039897...AlgebraISBN:9780079039897Author:CarterPublisher:McGraw Hill