
(a)
MPN for each level of employment.
(a)
Explanation of Solution
The marginal product of labor (MPN) is an additional output produced by an additional unit of labor.
It can be calculated using the following formula:
The table (1) below shows the MPN for each level of employment.
TABLE-1:
| Number of workers (N) | Number of widgets produced (Y) | Marginal product of labor (MPN) |
| 0 | 0 | |
| 1 | 8 | 8 |
| 2 | 15 | 7 |
| 3 | 21 | 6 |
| 4 | 26 | 5 |
| 5 | 30 | 4 |
| 6 | 33 | 3 |
(b)
The number of workers hired by the firm at given various levels of nominal wage.
(b)
Explanation of Solution
The equilibrium level of employment for a firm occurs when the nominal wage equals the marginal revenue product of labor. The marginal revenue product of labor is equal to the marginal product of labor times the price of the goods.
It is given that the price of the widget produced by the firm is equal to $5/unit.
Mathematically, the equilibrium condition of the level of employment can be expressed as follows:
Here,
MRPL is marginal revenue product of labor
MPN is a marginal product of labor
W is a nominal wage
P is the price of the good
The table (2) below shows the MRPL when the price is equal to $5/unit.
TABLE-2:
| Number of workers (N) | Number of widgets produced (Y) | Marginal product of labor (MPN) | Marginal revenue product of labor (MRPL) |
| 0 | 0 | ||
| 1 | 8 | 8 | 40 |
| 2 | 15 | 7 | 35 |
| 3 | 21 | 6 | 30 |
| 4 | 26 | 5 | 25 |
| 5 | 30 | 4 | 20 |
| 6 | 33 | 3 | 15 |
Now, according to employment equilibrium condition (1), when
- Nominal wage is equal to $38, the firm will hire 1 worker.
- Nominal wage is equal to $27, the firm will hire 3workers.
- Nominal wage is equal to $22, the firm will hire 4 workers.
As a firm hires labor up to the point where nominal wage equals the marginal revenue product of labor.
(c)
Graphical relationship between a firm’s labor
(c)
Explanation of Solution
Figure (1) below shows the graphical relationship between a firm’s labor demand and nominal wage.
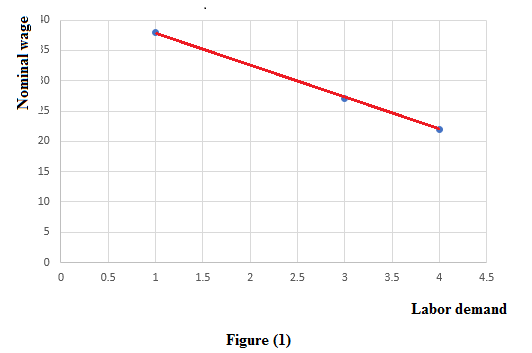
The graph in figure (1) is different from the labor demand curve because the labor demand curve plots the value of real wage equal to marginal product against the demand for labor.
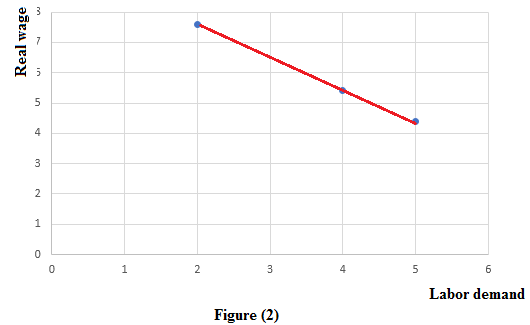
Real wage is equal to the nominal wage divided by the price level. Thus, at nominal wage $38, $27, $22 and price $5, the value of real wage is equal to $7.6, $5.4, and $4.4, respectively.
As in real terms, the firm hires a number of workers up to a point where the real wage is equal to the marginal product of labor. Thus, according to the table (1), at,
- Real wage equal to $7.6, the firm will hire 2 workers
- Real wage equal to $5.4, the firm will hire 4 workers
- Real wage equal to $4.4, the firm will hire 5 workers
The figure (2) below shows the firm’s labor demand curve. It depicts the graphical relationship between the real wage and labor demand.
(d)
Firm’s labor demand and production level at a fixed nominal wage of $38 and price $10/unit.
(d)
Explanation of Solution
The table (3) below shows the MRPL when the price is equal to $10/unit.
TABLE-3:
| Number of workers (N) | Number of widgets produced (Y) | Marginal product of labor (MPN) | Marginal revenue product of labor (MRPL) |
| 0 | 0 | ||
| 1 | 8 | 8 | 80 |
| 2 | 15 | 7 | 70 |
| 3 | 21 | 6 | 60 |
| 4 | 26 | 5 | 50 |
| 5 | 30 | 4 | 40 |
| 6 | 33 | 3 | 30 |
According to the employment equilibrium condition (1), at a fixed nominal wage $38, the firm will hire 5 workers. As beyond this level of workers, the marginal revenue product of labor (MRPL) falls below the nominal wage $38.
Thus, at fixed nominal wage $38 and increased price level from $5 to $10, the firm hires a greater number of workers compared to 1 worker found in part (b) and produces higher level of output equal to 30 units compared to 8 units found in part (b).
(e)
Effect on labor demand and production when there is an introduction of new technology.
(e)
Explanation of Solution
At fixed nominal wage $38 and price $5/unit, the firm was hiring 1 worker and production level was equal to 8 units. Now, it is given that the introduction of new technology doubles the number of units produced by the same number of workers.
When output doubles, then MPN double. This further doubles MRPL, as the MRPL rises to80. This is equal to MRPL in part (d), where the price was doubled from $5/unit to $10/unit.
Thus, the firm will hire the same number of workers equal to 5, as in part (d). It is just the production level that doubles from 30 units to 60 units due to the introduction of new technology.
(f)
Relationship between answers in part (d) and part (e).
(f)
Explanation of Solution
Since the marginal revenue product of labor (MRPL) is equal to the marginal product of labor (MPN) times the price (P) of the good, thus, any change in either P or MPN, will lead to an equivalent change in MRPL. And the equilibrium level of employment for a firm occurs when the nominal wage equals the marginal revenue product of labor.
This implies that the numbers of workers hired will remain the same in both the cases, i.e., when either P doubles as in part (d) or MPN doubles as in part (e).
Want to see more full solutions like this?
Chapter 3 Solutions
Macroeconomics

- Can you draw( i need a graphs) labor supply function : U(c,l)=log(c)+log(l) where, c-represents the consumption level of the individual and l-represents the leisure, while the market wage is 10 and available time is 20. Find and Draw the labor supply function! Grapharrow_forwardDistinguish the different Determinants of Labor Supply and Labor Demands. Give a short explanation of this simple graph. Wages £/hour Wage Q Quantity of Copyright: www.economicsonline.co.uk Labourarrow_forwardSummarize the articel. KUALA LUMPUR, Nov 3 ― A research by Khazanah Research Institute (KRI) found that agriculture employment has declined significantly to just 10.2 per cent out of the total employment nationwide in 2019, from 31.2 per cent in 1982. According KRI’s recently published report, “Work in an Evolving Malaysia: The State of Households 2020 Part II”, the decline was due to the country’s economic structure that has evolved over the years and caused concentration of economic activities continuing to differ between states. “The agriculture sector however remains an important source of employment in the north and east coast states such as Pahang, and in Sabah and Sarawak,” said KRI in the report. KRI found that the agriculture jobs tend to have slower productivity levels (Gross Domestic Product per employment) compared to states with less concentration in agricultural activities. “Additionally, agriculture has consistently reported a higher incidence of fatal injuries. “In some…arrow_forward
- Andy’s Beach Gear rents snorkels for $10 each. From past experience Andy knows how many rentals his workers can do, which is shown in the table below. Workers No. of Rentals 1 100 2 130 3 155 4 175 5 190 6 200 7 205 In the third column, calculate the MPL (marginal product of labor) for each worker. In the fourth column, calculate the VMPL (value of marginal product of labor) for each worker. At a wage of $150, how many workers should Andy hire? Calculate the average product of labor when Andy employs five workers? Using the data in the table construct a labor demand curve for Andy’s Beach Gear.arrow_forwardThe marginal product of labor for a firm is given by: MPL = 176 - 4H, where H is the number of hours they hire workers to work. For example, the marginal product of the first hour of labor would be 176 - 4*1, and the marginal product of the second hour of labor would be 176 - 4*2. If the market wage is $14 per hour, how many hours of labor will this firm hire? Round your final answer to two decimal places.arrow_forwardWhen a firm hired it tenth worker, its factory output increase by four units per month. Would you expect the firm's output to increase by eight more units per month if the firm hired two more workers? Explainarrow_forward
- Pizza production requires labor (cooks) and capital (ovens). If the wage rate for cooks is $15 per hour and the rental rate on ovens is $20 an hour and the MPP for cooks is 4 pizzas and the MPP for ovens is 10 pizzas, and a pizza costs $20, what should the firm do? Hire more labor because the MRP per dollar spent on labor is higher than capital. Hire more capital because the MRP per dollar spent on capital is hire than for labor. Hire more of both because they generate more revenue than they cost. O Do nothing.arrow_forwardAt its current employment level of labor and capital, a firm observes the following. Marginal product of labor = 30 units, Marginal product of capital = 60 units, Price of labor = $3 per unit and Price of capital = $6 per unit. This firm shouldarrow_forwardWill decrea n he fong run, assume a firm uses both labor and capital to produce 25 units of output. The marginal product of the last unit of labor being employed is 100; the marginal product of the last unit of capital being employed is 500. The wage rate of labor is $10. If the firm is minimizing the cost of producing 25 units of output, what must be the unit price of capital?arrow_forward
- Assume that the firms in the United States set their price as a markup on their wage cost. Assume every firm is identical in the United States, and that they set a wage equal to $22. Recall that the number of employed workers in the United States is 153.5 million. Q 6. Draw the average product of labor on the graph. This value will vary based on how you draw your own graph, but it needs to make sense given the wage. Is the average product of labor greater than, equal to, or less than the wage?arrow_forwardGraph the demand for labor as a function of the wage using this data. What happens to the number of workers when wage goes up? How many workers will be hired and how many cookies made at a wage of 40.50? Please give me the equations so I can understand how to create this graph.arrow_forwardAssume a firm employs 10 workers and pays each $15 per hour. Further assume that the MP of the 10th worker is 5 units of output and that the price of the output is $2. According to economic theory, in the short run the firm should reduce the number of workers employed. the firm should continue to employ 10 workers. more information is required to answer this question. the firm should hire additional workers.arrow_forward
 Economics: Private and Public Choice (MindTap Cou...EconomicsISBN:9781305506725Author:James D. Gwartney, Richard L. Stroup, Russell S. Sobel, David A. MacphersonPublisher:Cengage Learning
 Microeconomics: Private and Public Choice (MindTa...EconomicsISBN:9781305506893Author:James D. Gwartney, Richard L. Stroup, Russell S. Sobel, David A. MacphersonPublisher:Cengage Learning

 Economics (MindTap Course List)EconomicsISBN:9781337617383Author:Roger A. ArnoldPublisher:Cengage Learning