Concept explainers
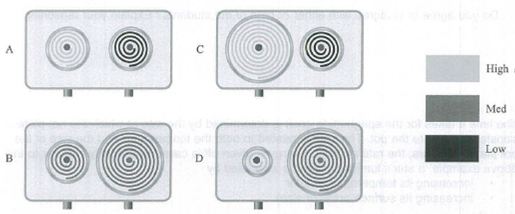
Imagine you are comparing the ability of electric hot plates of different sizes and temperatures to fully cook two identical large pots of spaghetti. Note that all the pots are as large as the largest hot plate. The shading of each hot plate is used to illustrate its temperature. The darker the shade of gray the cooler the temperature of the hot plate.
For each pair of hot plates shown below, circle the one that will cook the large pot of spaghetti more quickly. If there is no way to tell for sure, state that explicitly.

Learn your wayIncludes step-by-step video

Chapter 3 Solutions
Lecture- Tutorials for Introductory Astronomy
Additional Science Textbook Solutions
An Introduction to Thermal Physics
Life in the Universe (4th Edition)
The Cosmic Perspective Fundamentals (2nd Edition)
The Cosmic Perspective
Cosmic Perspective Fundamentals
The Cosmic Perspective (8th Edition)


- Tutorial Star A has a temperature of 5,000 K and Star B has a temperature of 6,000 K. At what wavelengths (in nm) will each of these star's intensity be at its maximum? If the temperatures of the stars increase, the wavelength of maximum intensity. What is the temperature (in K) of a star that appears most intense at a wavelength of 829 nm? Part 1 of 4 Wien's Law tells us how the temperature of a star determines the wavelength of maximum intensity or at what wavelength the star appears brightest. 2.90 x 10⁶ TK If the temperature is in kelvin (K) then A is in nanometers (nm). Anm ^A = AB = = Part 2 of 4 To determine the wavelengths of maximum intensity for the two stars: 2.90 x 10⁶ 2.90 x 10⁶ K nm nmarrow_forwardOrder the digital spectra above (shown in the second picture) from hottest to coldest. (Answer ABCDEFG, or DCBFGEA, or whatever is the correct order for your picture.)arrow_forwardAstronomers use two basis properties of stars to classify them. These two properties are luminosity and surface temperature. Luminosity usually refers to the brightness of the star relative to the brightness of our sun. Astronomers will often use a star’s color to measure its temperature. Stars with low temperatures produce a reddish light while stars with high temperatures shine with a brilliant blue—white light. Surface temperatures of stars range from 3000o C to 50,000o C. When these surface temperatures are plotted against luminosity, the stars fall into groups. Using the data similar to what you will plot in this activity, Danish astronomer Ejnar Hertzsprung and United States astronomer Henry Norris Russell independently arrived at similar results in what is now commonly referred to as the HR Diagram. Procedures:1. Read the Background Information 2. On the graph paper provided. Place a number next to the star according to its luminosity and surface temperature listed in the data…arrow_forward
- Use Wien's Law to calculate the peak wavelength of light coming from the Sun. Assume T=5800 K for the surface temperature of the Sun. Wein's displacement law says that the blackbody temperature and peak wavelength multiplied together give a constant of 0.29 cm-K. (K is degrees Kelvin). Convert the wavelength from part A into a frequency. The product of wavelength and frequency for electromagnetic radiation is a constant, the speed of light (c), 3 x 10^10 cm/s.arrow_forwardQuestion 9 Look at the three spectra of stars in the picture above. The top one, for instance, is the darkest at the blue end and the brightest at the red end. Using such considerations, list the top, middle and bottom spectra in order of temperature, highest to lowest.arrow_forwarda) To which object corresponds this spectrum to? b) What is the source of radiation for each of the two humps? c) Why does the hump on the right hand side peak at higher wavelength than the hump on the left? [Specifically, what does this tell you about the temperature for each object that the light originates from?]arrow_forward
- Star's apparent position Star Star Sun Deflected path Earth Eartharrow_forwardSpectrum I is showing a/an _____ spectrum created from Gas I, and spectrum II is a/an ______ spectrum created by Gas II. From the Spectrum it would be predicted that the gasses are ______arrow_forwardExplain how we use spectral absorption and emission lines to determine the composition of a gas.arrow_forward
- The greenhouse effect can be explained easily if you understand the laws of blackbody radiation. A greenhouse gas blocks the transmission of infrared light. Given that the incoming light to Earth is sunlight with a characteristic temperature of 5800 K (which peaks in the visible part of the spectrum) and the outgoing light from Earth has a characteristic temperature of about 300 K (which peaks in the infrared part of the spectrum), explain how greenhouse gases cause Earth to warm up. As part of your answer, discuss that greenhouse gases block both incoming and outgoing infrared light. Explain why these two effects don’t simply cancel each other, leading to no net temperature change.arrow_forwardStellar Classification and H-R Diagram Placement (40 points available). a. Where is your star located on the H-R diagram (luminosity class/region of the diagram, spectral class, luminosity/brightness)? How does this compare to that of The sun ? Discuss the inferences of the specific placement and stellar classification of your star with respect to mass, size/radius, color/temperature, composition? c. Discuss how this placement on the diagram relates to the star’s observed stage of evolution, previous evolution, and expected future evolutionary path. How does this compare to that of the Sun? d. What is the estimated total lifespan of your star and what is the estimated age of your star right now? How does this compare to that of the Sun? All of them is about Lutyen star .arrow_forwardThe blackbody emission spectrum of object A peaks in the ultraviolet region of the electromagnetic spectrum at a wavelength of 200nm. That of object B peaks in the red region, at 650nm. Which object is hotter, and, according to Wien's law, how many times hotter is it? note: please solve this accurate please please accurate and exact answer..thanksarrow_forward
 AstronomyPhysicsISBN:9781938168284Author:Andrew Fraknoi; David Morrison; Sidney C. WolffPublisher:OpenStax
 Stars and Galaxies (MindTap Course List)PhysicsISBN:9781337399944Author:Michael A. SeedsPublisher:Cengage Learning
 Foundations of Astronomy (MindTap Course List)PhysicsISBN:9781337399920Author:Michael A. Seeds, Dana BackmanPublisher:Cengage Learning