Videos
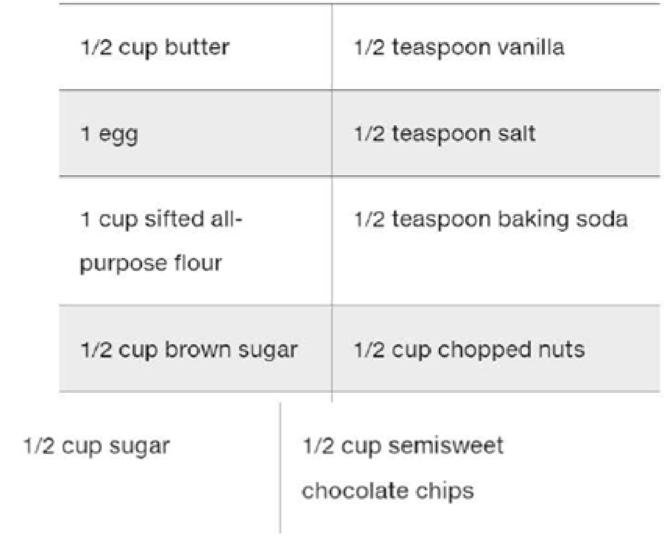
Create a flowchart that shows the necessary steps for making the cookies in the following recipe:
Ingredients:
Steps:
Preheat oven to 375°.
Cream the butter.
Add the sugar and the brown sugar to the butter and beat until creamy.
Beat the egg and vanilla into the mixture.
Sift and stir the flour, salt and baking soda into the mixture.
Stir the nuts and chocolate chips into the mixture.
Shape the mixture into 1/2-inch balls.
Place the balls about one inch apart on a greased cookie sheet.
Bake for 10 minutes.
Want to see the full answer?
Check out a sample textbook solution
Chapter 3 Solutions
Starting Out With Visual Basic (7th Edition)
Additional Engineering Textbook Solutions
Starting Out with Python (3rd Edition)
Digital Fundamentals (11th Edition)
Database Concepts (7th Edition)
Starting Out with Java: From Control Structures through Objects (6th Edition)
Starting Out with Programming Logic and Design (4th Edition)
Starting Out with Java: From Control Structures through Data Structures (4th Edition) (What's New in Computer Science)


- Sort the following list of values into ascending order using the RadixSort algorithm.[420 531 642 037 753 858 969 300 230 111 001 100 444]Note: If you need to place multiple values in a textbox, use only a single space to separate them (ie, not commas, not more than one space, etc). For textboxes not used, enter the word empty. Pass#1 Pass#2 Pass#3Bucket 0: Bucket 1: Bucket 2: Bucket 3: Bucket 4: Bucket 5: Bucket 6: Bucket 7: Bucket 8: Bucket 9:arrow_forwardFavorite Color Rank the following colors according to your preference with 1 being the most preferred and 5 the least preferred color. Survey Result: (50 respondents) Favorite Color Ranking 1st 2nd 3rd 4th 5th Blue 8 7 9 15 11 Red 16 9 7 9 9 Yellow 11 14 11 5 9 Violet 4 11 17 10 8 Green 11 9 6 11 13 Instructions: Create a preference schedule for the rankings cast by your respondents.arrow_forwardImplement the using Windows form App(.NET Framework) c# : 1- creat a Form titled “ Students ” 2- Add text box with max 100 letter, where student can enter his name 3- Add Grade combobox where student can select his grade (A-B-C-D-E-F) 4- Add button “Add”, when clicked the name and grade are added to the data view5- Add button “Stat” when clicked another form appears6- A data grid appears with grade vs count statistic (ex : A ,3 ) (please respond with screenshots )arrow_forward
- DIRECTION: Analyze the following code snippet below. Give the final output.arrow_forwardCreate flowchart to print Multiplication Table for 5 from 1 to 12 ( Follow the same format of Multiplication table: 1 * 5 = 5 2 * 5 = 10 … 12* 5 = 60 )arrow_forwardQ22. Draw the flowchart to • Read the number from the user • Check the number range then print the corresponding Planet Name as given in Table-Q17 using else if ladder statement. Table-Q17 number Planet Name 1-10 EARTH 11-20 JUPITER 21-30 MARS 31-40 URANUS Other numbers Invalid Inputarrow_forward
- Ch: Color and Grayscale Levels 3. A user can set color-table entries in a PHIGS application program with the function a) setColourRepresentation (ws, ci, colorptr) b) setColorRepresentation (ws, ci, colorptr) c) setColour (ws, ci, colorptr) d) setColourRepresentation ()arrow_forwardTrue/False 10. In a flowchart, diamonds are used to show statement sequences, and rectangles are used for decision points.arrow_forwardVBA PROBLEM: Create a code where every time that only cell B1 is changed, create a new tab and that this tab is renamed with the value that is entered in B1 and the other cells, that is, B2: B11 have the same values that are entered in the Sheet1. The values of A1: A11 must always remain the same. Like in the examples below (image 1 and 2).arrow_forward
 Np Ms Office 365/Excel 2016 I NtermedComputer ScienceISBN:9781337508841Author:CareyPublisher:Cengage