
Videos
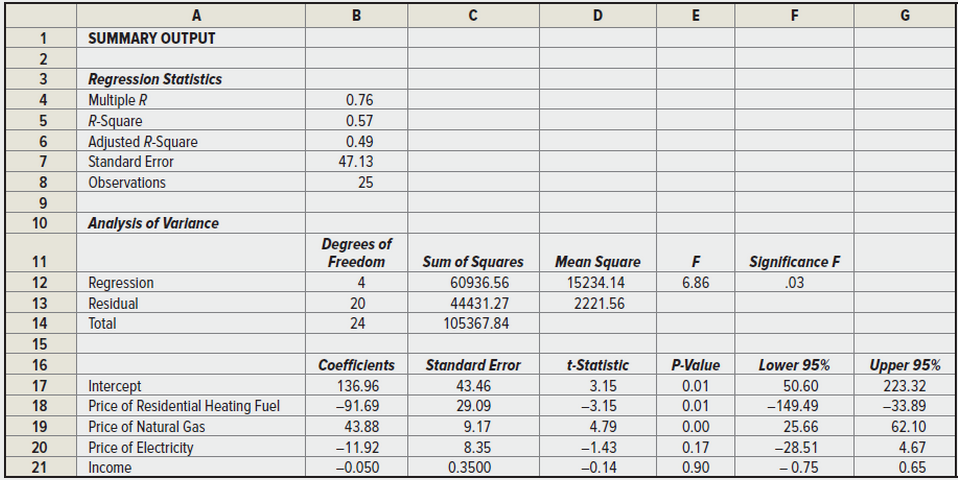
As newly appointed “Energy Czar.” your goal is to reduce the total demand for residential heating fuel in your state. You must choose one of three legislative proposals designed to accomplish this goal: (a) a tax that would effectively increase the price of residential heating fuel by $1, (b) a subsidy that would effectively reduce the price of natural gas by $3, or (C) a tax that would effectively increase the price of electricity (produced by hydroelectric facilities) by $4. To assist you in your decision, an economist in your office has estimated the demand for residential heating fuel using a linear demand specification. The regression results are presented as follows. Based on this information. which proposal would you favor? Explain.
Want to see the full answer?
Check out a sample textbook solution
Chapter 3 Solutions
Managerial Economics & Business Strategy (Mcgraw-hill Series Economics)
Additional Business Textbook Solutions
ECON: MICRO4 (New, Engaging Titles from 4LTR Press)
Principles of Microeconomics
Engineering Economy (16th Edition) - Standalone book
Economics of Money, Banking and Financial Markets, The, Business School Edition (5th Edition) (What's New in Economics)
Contemporary Engineering Economics (6th Edition)
Foundations of Economics (8th Edition)


- The demand (D) and supply (S) function for a commodity are P =100 – 2Q and P = 10 + Q, respectively. (a) Find the equilibrium price and quantity. That is, find the price and quantity where the D and S functions intersect. (b) A new 10% tax is imposed on this commodity. Find the burden of the tax on demanders and the burden on suppliers. Also find the total taxes. [In order to insure that we all do this problem in the same way, let’s assume that the tax is imposed on the supply side of the market. In addition, the burden of the tax on demanders is the difference in price demanders pay when the tax is in existence less the price they paid when there was no tax. The burden on suppliers is the difference in price suppliers received when there was no tax and the net price (after remitting tax to the government) they receive when the tax is in existence.]arrow_forwardThe demand (D) and supply (S) function for a commodity are P=100 - 20 and P = 10 + Q, respectively. (a) Find the equilibrium price and quantity. That is, find the price and quantity where the D and S functions intersect. (b) A new 10% tax is imposed on this commodity. Find the burden of the tax on demanders and the burden on suppliers. Also find the total taxes. [In order to insure that we all do this problem in the same way, let's assume that the tax is imposed on the supply side of the market. In addition, the burden of the tax on demanders is the difference in price demanders pay when the tax is in existence less the price they paid when there was no tax. The burden on suppliers is the difference in price suppliers received when there was no tax and the net price (after remitting tax to the government) they receive when the tax is in existence.]arrow_forwardThe Senate committee is working on tax reform for telecommunications services in the USA. After deregulation, the telecom market has become very competitive and the high telecom tax rate (25%) reduces business growth. Estimates indicate that the current monthly demand for telecom services is given by Q^d=300-4P and the market supply is Q^s=3P-120P (both in millions), where P is the monthly price of telecom services. The Commission plans tax reform that would cut a tax rate to 15%, leading to a new supply function Q^s=4P-60. How much will the customer save on average during a month as a result of the proposed legislation? How will tax revenues change?arrow_forward
- The graph below shows the short- and long-run supply (Ssr, Slr) and demand (Dsr, Dlr) curves for water in a metropolitan water district. The price ceiling, Pceil, is currently set to be nonbinding. Adjust the ceiling by repositioning the Pceil line to a price that leads to a short- run shortage of 2.1 million cubic feet per month. To refer to the graphing tutorial for this question type, please click here. Price ($ per 100 cubic feet) 7.5 7 6.5 6 5.5 5 4.5 4 3.5 3 2.5 2 1.5 1 0.5 ● 0 2.8 3 6 B T 1 1 1 I I 24 28 B 4244 O ….…….…….…... Ssr Sir Pceil Dir Dsrarrow_forwardThe short-run demand and supply elasticities for crude oil are -0.076 and 0.088, respectively. The current price per barrel is $30 and the short-run equilibrium quantity is 23.84 million barrels per year. What will be the effects on the market price and quantity if the government decides to purchase (and store away) an additional 2 million barrels of oil? Assume that the additional consumption of oil by the government results in a parallel shift of the supply curve to the left by 2 million barrels per day What could be the economic rationale for buying and storing oil?arrow_forwardSuppose (the numbers are loosely based on reality) that the tax on petrol is raised from 40 cents per litre to 60 cents per litre. The before-tax total cost of retailing petrol is $1.20 per litre. Assume that 100% of the tax is always passed through to consumers. After the increase in taxes, the quantity of petrol sold falls from 3,000,000 litres a day to 2,800,000 litres a day. Calculate the price elasticity of demand for petrol using the mid-point formula, based on the change in price due to the tax. Use three decimal places in your calculations. What are the implications for policymakers who want to raise revenue, when considering raising taxes on petrol?arrow_forward
- Paper cups are popular items for schools and are produced in the market. There are equations for the Supply and Inverse Demand of paper cups that model its Supply and Demand graph. These equations are (for supply), P = 2 + 3Qs, and (for Inverse Demand), P = 12 - 2Qd. Likewise, paper cups are inexpensive and not very helpful for companies trying to achieve high profits. As a result, the government placed a price support of $9. (Part I) Draw the market equilibrium with the government intervention (Q**, P**) of the price ceiling. Please label the graph for slopes, equilibrium points, price support, etc. (Part II) What is the market equilibrium with the intervention of the government (Q**, P**)? (Part III) What is the government surplus (GS**)? (Part IV) What is the Dead Weight Loss (DWL**)?arrow_forwardConsumers' Surplus The demand function for a certain make of replacement cartridges for a water purifier is given by the following equation where p is the unit price in dollars and x is the quantity demanded each week, measured in units of a thousand. p = -0.01x? - 0.2x + 26 Determine the consumers' surplus if the market price is set at $2/cartridge. (Round your answer to two decimal places.)arrow_forwardSuppose the supply and demand equations for a manufacturer's product are p 3 -g + 6 100 1 and p ng + 14, respectively, where q represents number of units and p represents price per unit in dollars. If a tax of $1.00 per unit is imposed on the manufacturer, determine the equilibrium quantity and the equilibrium price.arrow_forward
- The tax-inclusive price of a carton of cigarettes in Canada is $100 per carton. Per capita consumption is 10 cartons. Federal and provincial taxes are currently $50 per carton. Suppose the two levels of government wish to increase the cigarette tax by 20 percent. If the price elasticity of demand is -0.25, what is the additional per capita tax revenue that the two levels of government can expect to collect?arrow_forwardThe freezing cold spell at the beginning of 2010 not only increased demand for road salt, (see the additional case study for chapter 6) but it increased demand for gas in the UK. Usage reached 454 cubic metres; the previous record was 449m set in January 2003. The National Grid which is responsible for energy in the UK issued several warnings in a matter of days that demand could outstrip supply and asked supplier so increase the supply. The National Grid also told major gas users, such as power plants, to reduce demand. Big generators, such as E.On, have both gas-fired and coal-fired power stations and are able to choose between the two. In total, 27 large gas users were asked to switch - 12 in the East Midlands and 15 in the North West. Questions Discuss the effect of the cold spell on the demand for gas using a demand curve diagram. Discuss the effect of the National Grid instructing major gas users to reduce their demand.arrow_forwardThe freezing cold spell at the beginning of 2010 not only increased demand for road salt, (see the additional case study for chapter 6) but it increased demand for gas in the UK. Usage reached 454 cubic metres; the previous record was 449m set in January 2003. The National Grid which is responsible for energy in the UK issued several warnings in a matter of days that demand could outstrip supply and asked supplier so increase the supply. The National Grid also told major gas users, such as power plants, to reduce demand. Big generators, such as E.On, have both gas-fired and coal-fired power stations and are able to choose between the two. In total, 27 large gas users were asked to switch - 12 in the East Midlands and 15 in the North West. Questions 1. Illustrate the effect of the cold spell on the demand for gas using a demand curve diagram. 2. Illustrate the effect of the National Grid instructing major gas users to reduce their demand. 3. Analyse two other factors that you think…arrow_forward
