
Identify the effect of the events on the quantity of real GDP supplies and
Explanation of Solution
- The U.S firm move their call handling, IT, and data function to Country I:
A movement of call handling, IT, and data function from the U.D firm to Country I’s firm will cause an expansion of a business. In order to expand the business of the firm, it will result in demanding new capital, increase employment, and production. Therefore, the quantity of real GDP supplies and aggregate supply will increase.
Figure -1 shows the effect of movement of business from one firm to other firms as follows:
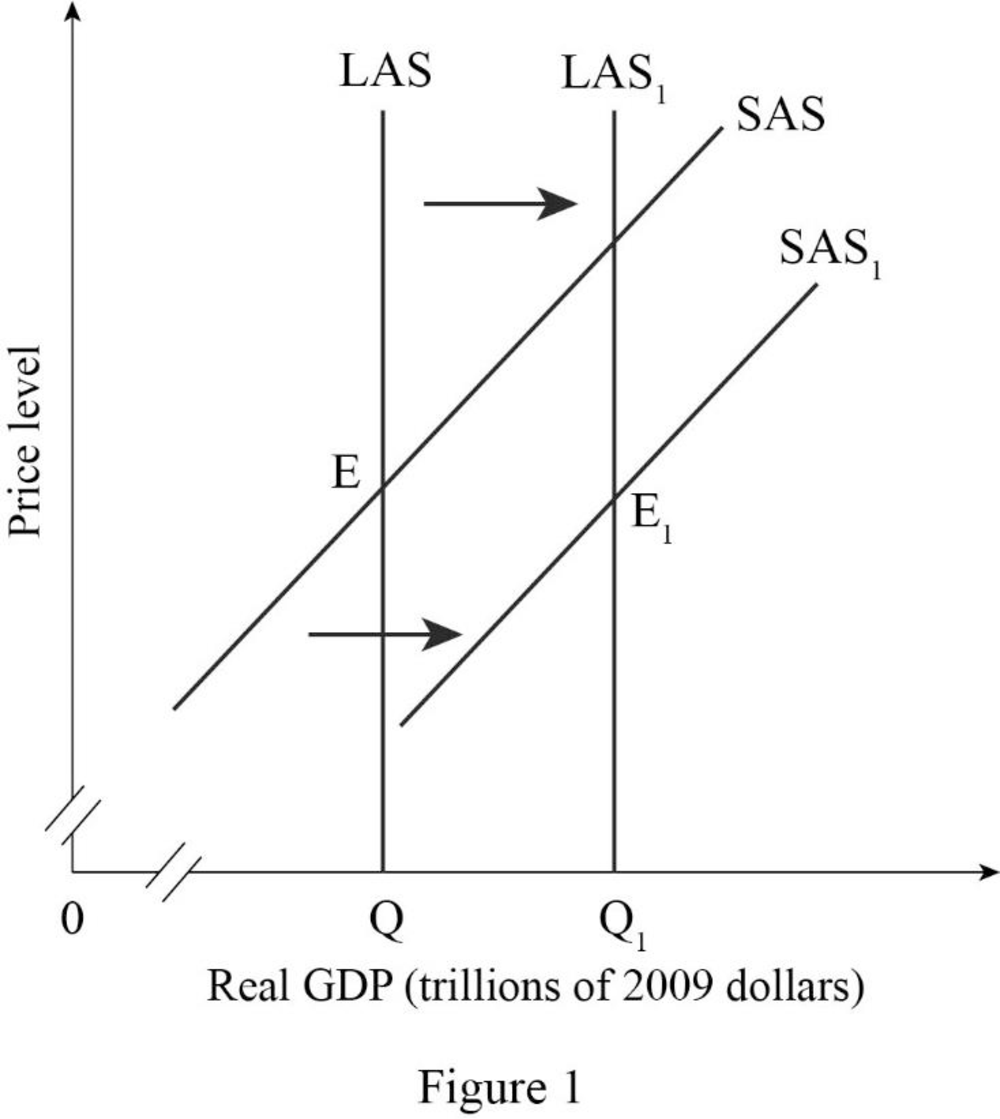
In Figure -1, the horizontal axis measures real GDP and the vertical axis measures price level.
In Figure -1, the curve short-run aggregate supply (SAS), long-run
- Fuel price rise:
A rise in fuel price will result in an increase in the price level, which will rise the cost of production and temporarily decrease the aggregate supply. This will cause the short-run supply shift to the leftward direction and long-run aggregate supply curve remain unchanged.
Figure -2 shows the impact of rising in fuel price as follows:
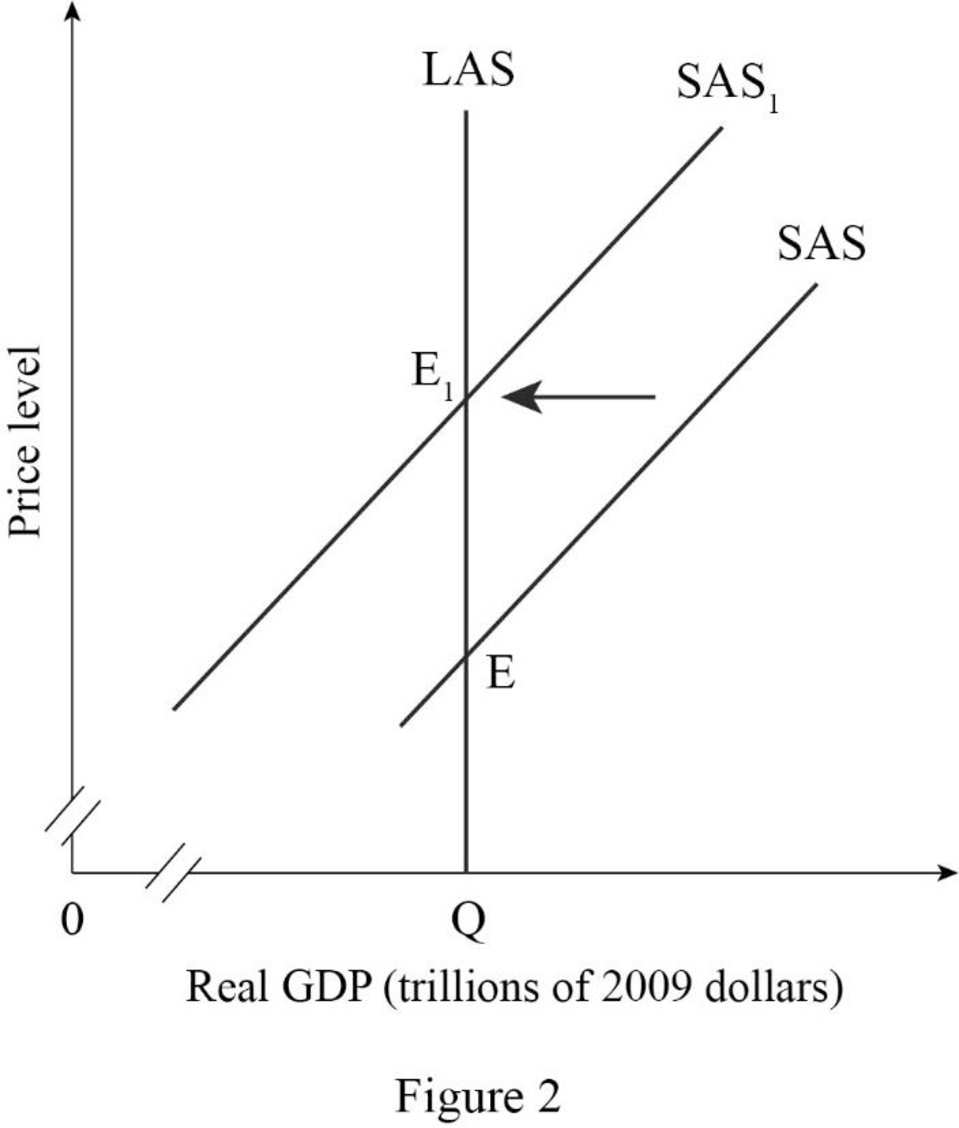
In Figure -2, the horizontal axis measures real GDP and the vertical axis measures price level.
In Figure -2, point E represents the initial equilibrium of the economy. Since as the rise in price cause a temporary decrease in short-run aggregate supply, which result in short-run aggregate supply curve shift to the leftward direction. Therefore, point E1 represents the new equilibrium point and SAS1 is the new short-run aggregate supply curve.
- Walmart and Starbucks open in Country I:
The Walmart and Starbucks open in Country I, which causes an expansion of their business. In order to expend the business of the firm, which will result in demanding new capital, increased employment, and production. Therefore, the quantity of real GDP supplies and aggregate supply will increase.
Figure -3 shows the effect of the expansion of business from one country to another country as follows:
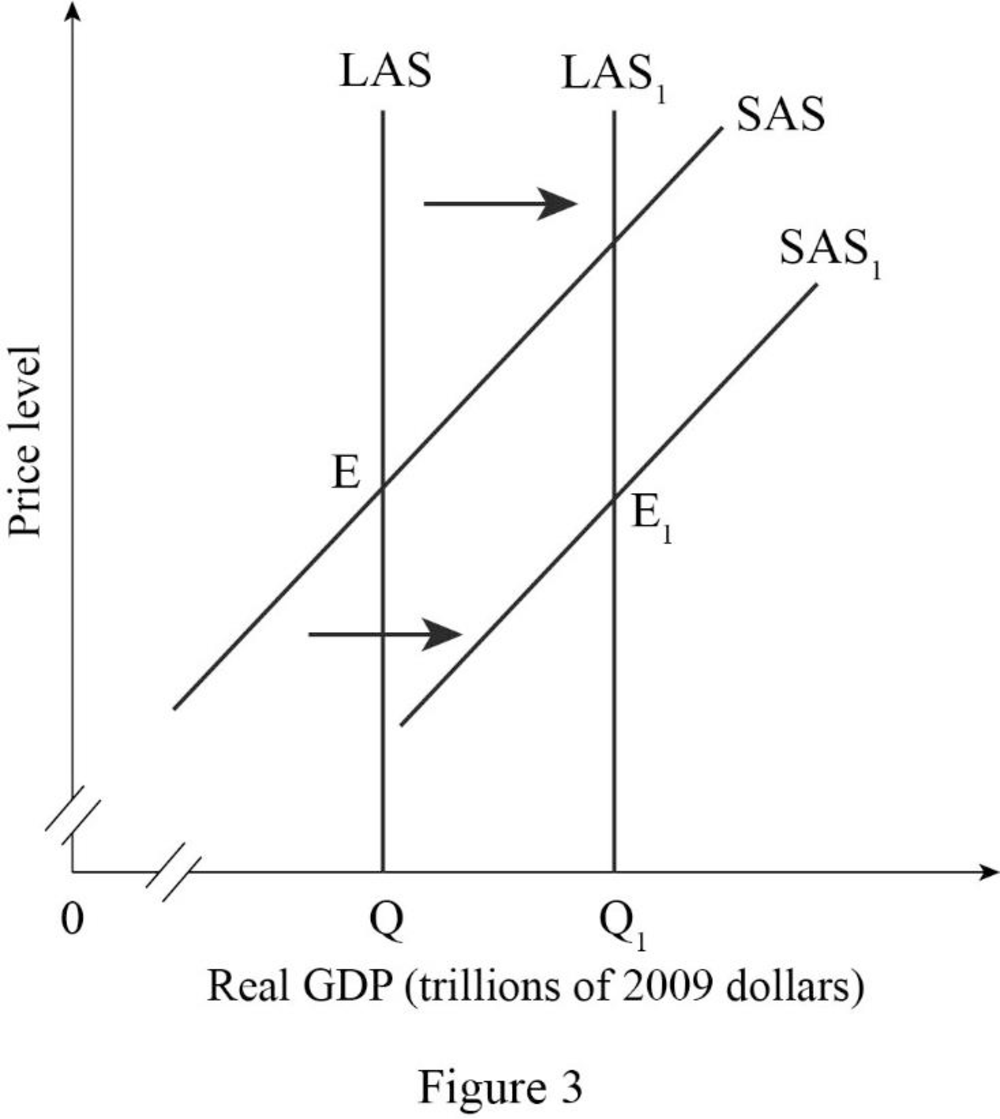
In Figure -3, the horizontal axis measures real GDP and the vertical axis measures price level.
In Figure -3, the curve short-run aggregate supply (SAS), long-run aggregate supply curve (LAS) at output Q represents the initial outcome of the economy. The result of the expansion of a business into one country to another country will cause an increase in long-run aggregate supply and short run aggregate supply and will result in a long-run aggregate supply curve (LAS1) and short-run aggregate supply curve (SAS1) shift to the rightward direction.
- Universities in the Country I increase the number of engineering graduates.
An increase in the number of engineering graduates in Country I will result in an increase in human capital and opportunity of employment expansion. Therefore, the quantity of real GDP supplies and aggregate supply will increase.
Figure -4 shows the effect of expansion of business from one country to another country as follows:
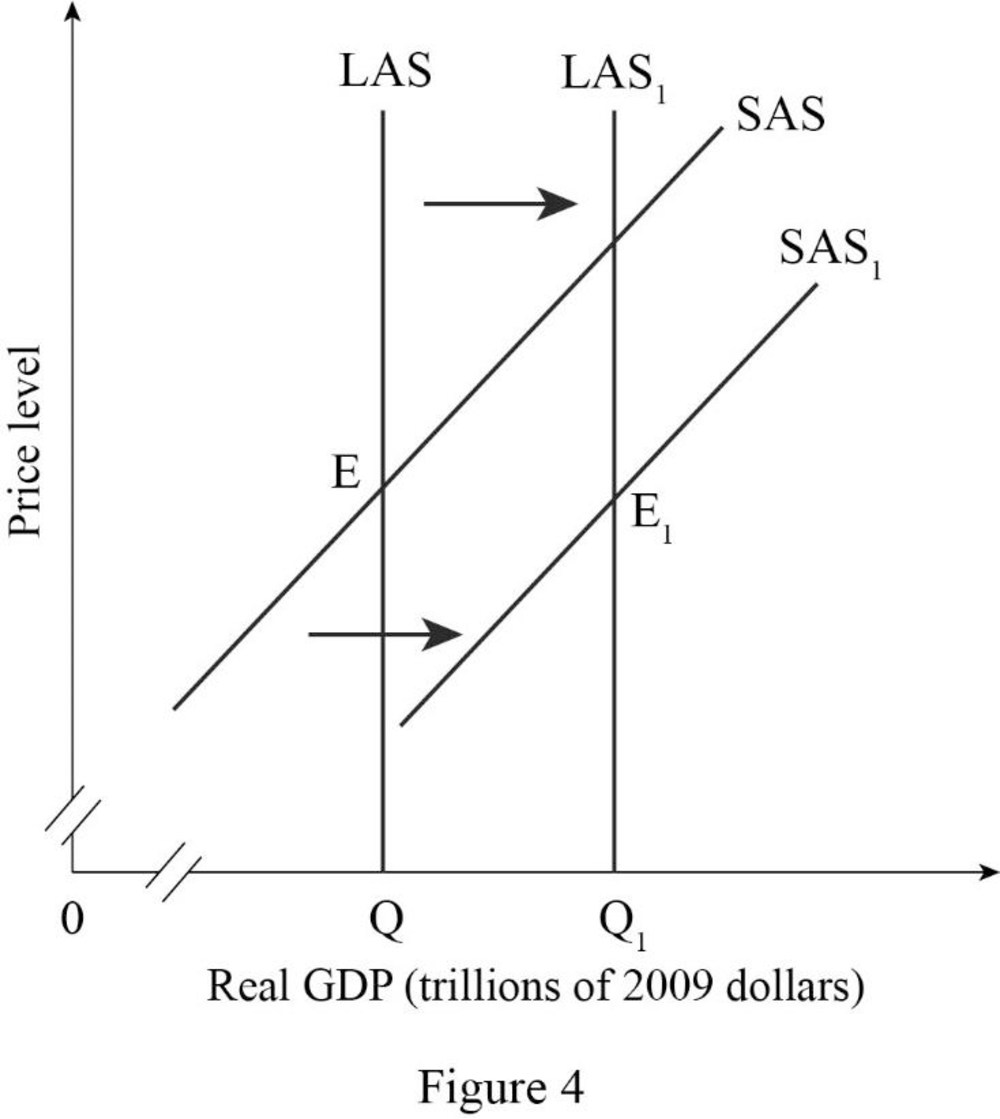
In Figure -4, the horizontal axis measures real GDP and the vertical axis measures price level.
In Figure -4, the curve short-run aggregate supply (SAS), long-run aggregate supply curve (LAS) at output Q represents the initial outcome of the economy. The result of an increase in the human capital and employment opportunity will cause an increase in long-run aggregate supply and short-run aggregate supply, which will result in a long-run aggregate supply curve (LAS1) and short-run aggregate supply curve (SAS1) shift to the rightward direction.
- The money wage rate rises:
An increase in the money wage rate causes an increase in the cost of production of the firm because with the existing employment rate, the firm will pay a high salary or wage for the same quantity of output. Therefore, there occur a temporarily decrease in the aggregate supply, which will cause the short-run supply to shift to the leftward direction and long-run aggregate supply curve remain unchanged.
Figure -5 shows the effect of a rise in the money wage rate as follows:
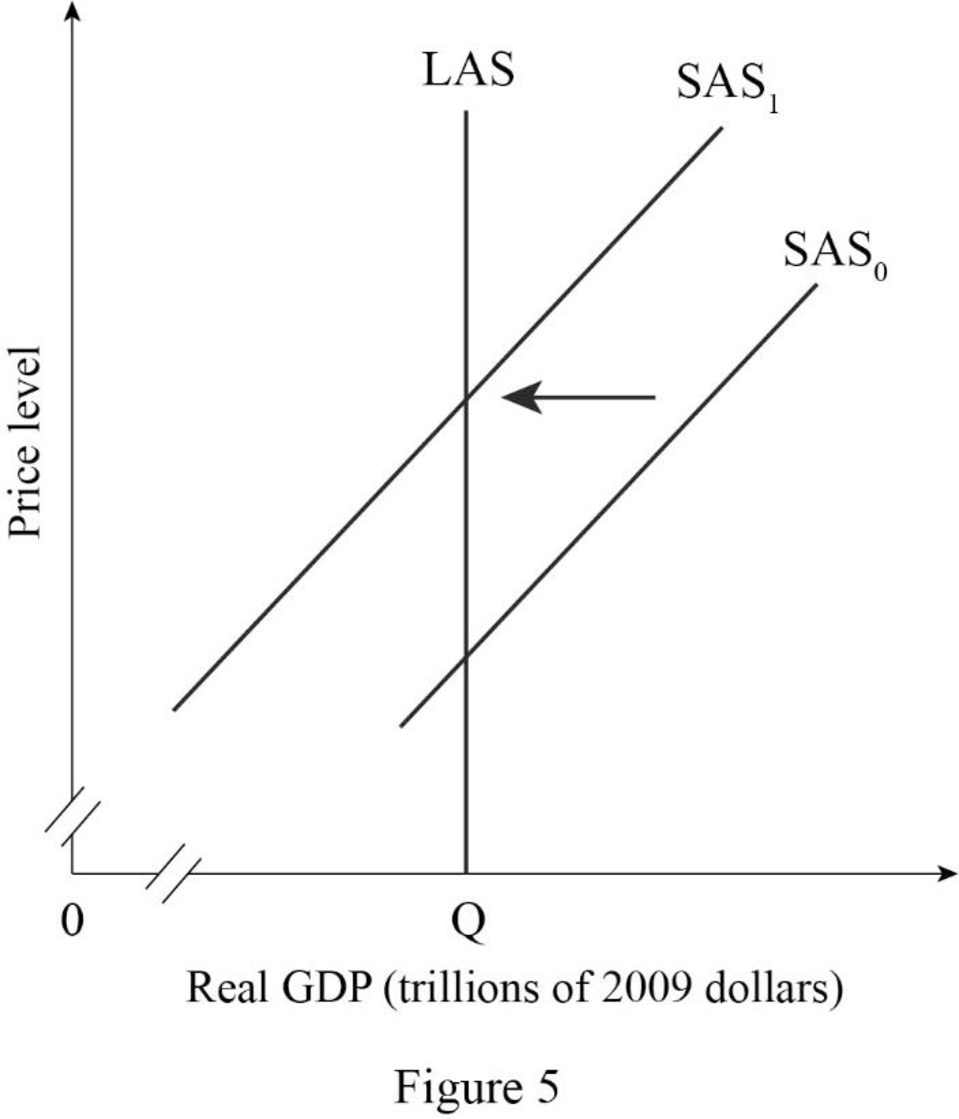
In Figure -5, the horizontal axis measures real GDP and the vertical axis measures price level.
In Figure -5, point E represents the initial equilibrium of the economy. Since as a rise in money wage rate causes a temporary decrease in short-run aggregate supply, which results in short-run aggregate supply curve shift to the leftward direction. Therefore, point E1 represents new equilibrium point and SAS1 is the new short-run aggregate supply curve.
- The price level in Country I increases:
In the short-run, an increase in the price level in the Country I cause an increase in the quantity supply of real GDP. Since an increase in price level causes an increase in the money wage rate, hence, in the long run, there occur an upward movement or real GDP along with long-run aggregate supply curve.
Figure -6 shows the impact of rise in the price level in Country I as follows:
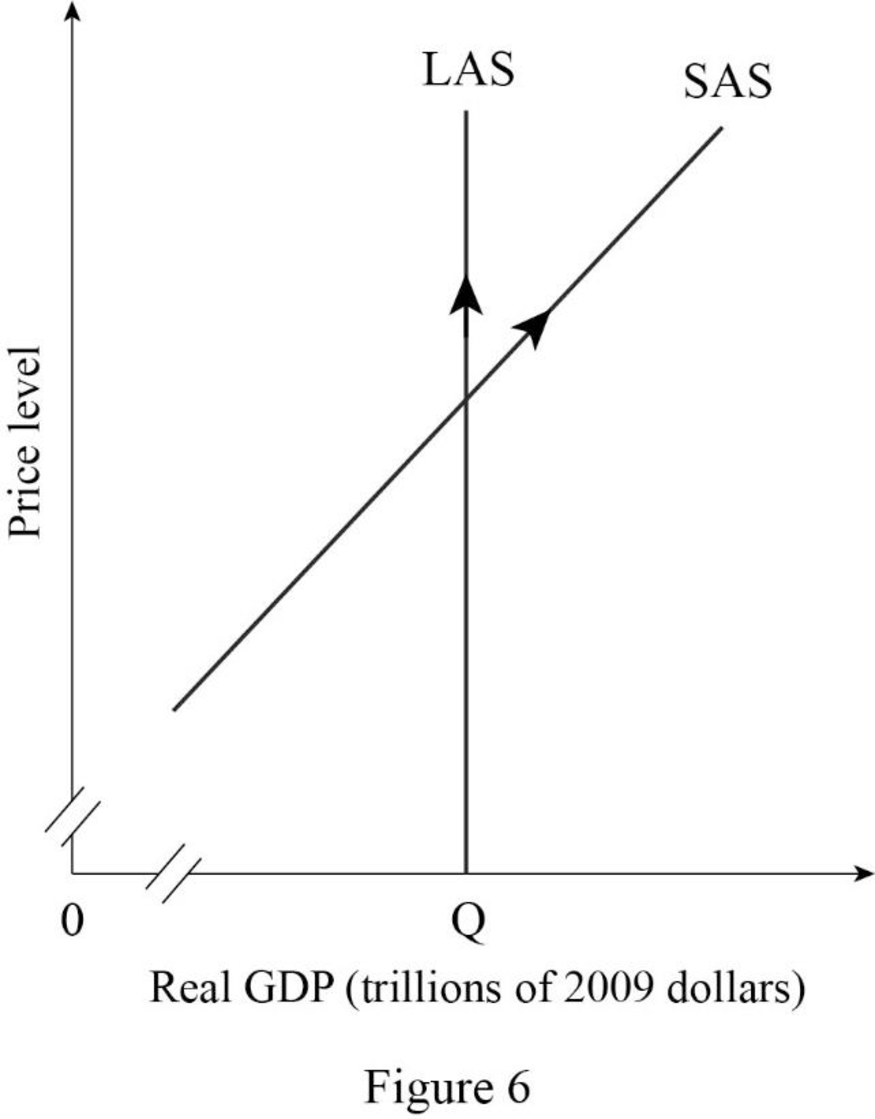
In Figure -6, the horizontal axis measures real GDP and the vertical axis measures price level.
In Figure -6, a rising in the price level causes a rise in money wage rate, hence in the long-run, the quantity supplied of real GDP increases. Therefore, there occurs an upward movement along with the long-run aggregate supply curve and the short-run aggregate supply curve.
Want to see more full solutions like this?
Chapter 27 Solutions
Macroeconomics
- Explain the influence of each of the following events on the quantity of real GDP supplied and aggregate supply in India and use a graph to illustrate. A. Fuel prices risesarrow_forwardWhich of the following is not a component of the aggregate demand curve?a.Government spending(G)b.Investment(I)c.Consumption(C)d.Net Exports(X-M)e.Savingarrow_forwardAn economy is described by the following equations: Supply: Y=F(K,L)=6K^0.6L^0.4 K=405, L=110 Demand: C=231+0.8(Y-T) |=1161.0-129r G=150,T=120 NX=125-490e r=r*= 5 A. What Is the level of GDP in this economy? B. How much are household savings? C. How much Is the government saving? D. How much is National Saving? E. How much is investment spending? F. Net capital outflow is: G. Equilibrium exchange rate is : Suppose G drops to 142, Find: H. National Saving I. Investment J. New trade balance K. New Equilibrium exchange ratearrow_forward
- Draw the graph (aggregate supply and aggregate demand curves) of an economy that is in equilibrium.arrow_forwardSpecify the supply determinants of real GDP. List the factors of each category and explain in detail.arrow_forwardDescribe how different parts of the economy may have experienced shifts and changes in supply and demand. Provide at least 4 examples.arrow_forward
- The following graph shows an increase in short-run aggregate supply (SRAS) in a hypothetical economy. Specifically, short-run aggregate supply shifts to the right from SRAS₁ to SRAS2, causing the quantity of output supplied at a price level of 125 to rise from $250 billion to $350 billion. Review the graph and then complete the table that follows. PRICE LEVEL 200 175 150 125 100 75 50 25 0 0 50 SRAS SRAS₂ 100 150 200 250 300 350 400 REAL GDP (Billions of dollars) ? The following table lists several determinants of short-run aggregate supply. Complete the table by indicating the change needed in each determinant to increase short-run aggregate supply. Determinant Change Needed to Increase SRAS Input Prices increase or decrease Burdensome Regulations increase or decrease Technology decline or improvementarrow_forwardWhich of the following is not a component of the aggregate demand curve? a.Government spending(G) b. Investment (I) c. Consumption (C) d. net exports (X-M) e. Savingsarrow_forwardthe phrase "a sustained increase in the average level of prices for goods and services in an economy over time" describes which of the following terms?arrow_forward
- The imaginary country of Harris Island has the aggregate supply and aggregate demand curves as Table shows. Price Level: AD/AS Price Level AD AS 100 800 300 120 700 425 140 600 600 160 500 670 180 400 720 Plot the AD/AS diagram (You don't have to submit the plot, but I recommend doing it as it will help you with this problem). Identify the equilibrium. Blank #1 - Equilibrium Price Level Blank #2 - Equilibrium GDP Blank #3 - Would you expect unemployment in this economy to be relatively high or low? Blank #4 - Would you expect concern about inflation in this economy to be relatively high or low? Imagine that consumers begin to lose confidence about the state of the economy, and so AD becomes lower by 275 at every price level. Blank #5 - What is the new equilibrium GDP? Blank #6 - What is the new equilibrium Price Level? How will the shift in AD affect (answer is rise or fall)... Blank #7 - the original output? Blank #8 - the price…arrow_forwardThe imaginary country of Harris Island has the aggregate supply and aggregate demand curves as Table shows. Price Level: AD/AS Price Level AD AS 100 800 300 120 700 425 140 600 600 160 500 670 180 400 720 Plot the AD/AS diagram (You don't have to submit the plot, but I recommend doing it as it will help you with this problem). Identify the equilibrium. Blank #1 - Equilibrium Price Level Blank #2 - Equilibrium GDP Blank #3 - Would you expect unemployment in this economy to be relatively high or low? Blank #4 - Would you expect concern about inflation in this economy to be relatively high or low? Imagine that consumers begin to lose confidence about the state of the economy, and so AD becomes lower by 275 at every price level. Blank #5 - What is the new equilibrium GDP? Blank #6 - What is the new equilibrium Price Level? How will the shift in AD affect (answer is rise or fall)..arrow_forwardHow would the following changes shift aggregate demand? Label whether it is an "increase in aggregate demand (shifts right)", "decrease in aggregate demand (shifts left)", or "does not shift in aggregate demand". The government increases taxes. The value of housing assets decreases. Domestically made goods become more desirable abroad. The government begins a major new social safety net program. Wages go up throughout the economy.arrow_forward

 Economics (MindTap Course List)EconomicsISBN:9781337617383Author:Roger A. ArnoldPublisher:Cengage Learning


