
Subpart (a):
The graphical illustration for the changes in
Subpart (a):
Explanation of Solution
Figure 1 shows the shift in the supply curve of labor force.

In Figure 1, the vertical axis measures the price level and the horizontal axis measures the aggregate output. The upward sloping curves AS0 and AS1 are aggregate supply curves. The decrease in the size of labor force reduces the supply of labor in the market. It shifts the
Concept introduction:
Aggregate Supply (AS): Aggregate supply refers to the total value of the goods and the services available for purchase at a particular price in a given period of time.
Subpart (b):
The graphical illustration for the changes in aggregate supply.
Subpart (b):
Explanation of Solution
Figure 2 shows the changes in the aggregate supply curve of capital.

In Figure 2, the vertical axis measures the price level and the horizontal axis measures the aggregate output. The upward sloping curves AS0 and AS1 are aggregate supply curves. The increase in available capital increases the supply of capital in the market. It shifts the supply curve from AS1 to AS0.
Concept introduction:
Aggregate Supply (AS): Aggregate supply refers to the total value of the goods and services available for purchase at a particular price in a given period of time.
Subpart (c):
The graphical illustration for the changes in aggregate supply.
Subpart (c):
Explanation of Solution
Figure 3 shows the changes in aggregate supply curve.
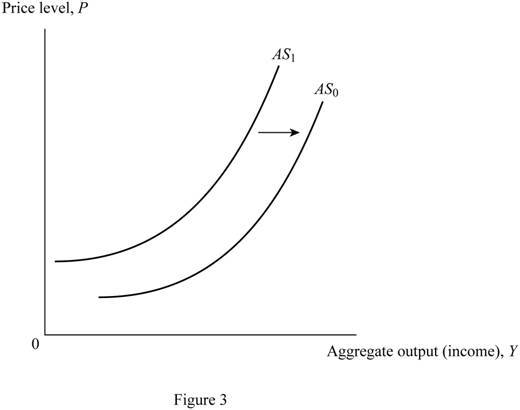
In Figure 3, the vertical axis measures the price level and the horizontal axis measures the aggregate output. The upward sloping curves AS0 and AS1 are aggregate supply curves. An increase in the productivity, as a result of a technological change, shifts the aggregate supply curve to the right (from AS1 to AS0).
Concept introduction:
Aggregate Supply (AS): Aggregate supply refers to the total value of the goods and services available for purchase at a particular price in a given period of time.
Subpart (d):
The graphical illustration for the changes in aggregate supply curve.
Subpart (d):
Explanation of Solution
Figure 4 shows the changes in aggregate supply curve.
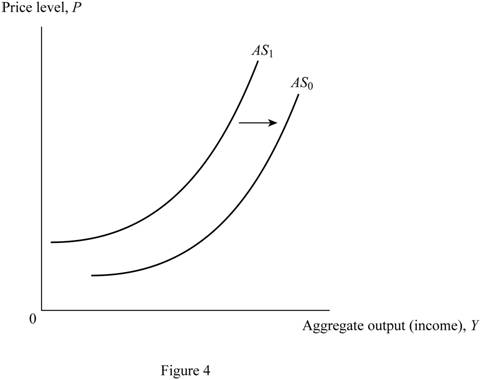
In Figure 4, the vertical axis measures the price level and the horizontal axis measures the aggregate output. The upward sloping curves AS0 and AS1 are aggregate supply curves. The increase in the price of oil increases the supply of oil in the market. It shifts the aggregate supply curve rightward (from AS1 to AS0).
Concept introduction:
Aggregate Supply (AS): Aggregate supply refers to the total value of the goods and services available for purchase at a particular price in a given period of time.
Want to see more full solutions like this?
Chapter 26 Solutions
Principles of Economics (12th Edition)

- Draw an aggregate demand and supply diagram for Japan. In the diagram, show how each of the following affects aggregate demand and supply: The U.S. gross domestic product falls. The level of prices in Korea falls. Labor receives a large wage increase. Economists predict higher prices next year.arrow_forward17 01:27:36 Use the following diagrams for the U.S. economy to answer the next question. AS₁ AS₂ 这 AD Real GDP (1) AS₂ AS, * AD (3) Real GDP (2) NY AD₂ AD₁ Real GDP AD₂ Real GDP AD₁ If the economy is initially at full employment, which of the diagrams best portrays a recession resulting from a decrease in government purchases?arrow_forwardThe table below shows information on aggregate supply, aggregate demand and the price level for the imaginary country of Xurbia. Price Level AD AS 110 700 600 120 690 640 130 680 680 140 670 720 150 660 740 160 650 760 170 640 770 Plot the AD/AS diagram from the data shown (Don't have to show graph but do draw it to help you answer the questions). a. Identify the equilibrium. b. Imagine that as a result of a government tax cut, aggregate demand becomes higher by 50 at every price level. Identify the new equilibrium. c. How will the new equilibrium alter output? How will it alter the price level? What do you think will happen to employment?arrow_forward
- Write the definition of Macroeconomics with example? Describe the concept of aggregate demand and aggregate supply? In macroeconomy how and where we will get the equilibrium level with the help of aggregate demand and aggregate supply?arrow_forwardThe following graph shows the short-run and long-run aggregate supply curves (SRAS and LRAS) for an economy. Suppose there is a technological improvement that allows firms to reduce their costs of production permanently. Drag one or both of the curves on the graph to illustrate the long-term effects of this change. If you don't believe there will be any long-term effects, leave the curves where they are. 240 LRAS SRAS 200 SRAS 160 LRAS 120 80 40 6 12 18 24 REAL GDP (Trillions of dollars) Assuming aggregate demand is not affected by the technological improvement, the long-run effect of this v supply shock is v in aggregate output and v in the price level. PRICE LEVELarrow_forwardIllustrate each of the following situations with a graph showing the Short-run Aggregate Supply curve: a. A decrease in productivity of labor and capitalarrow_forward
- What is aggregate demand and supply?arrow_forwardQUESTION 2 Explain whether each of the following events will increase, decrease or have no effect on long-run aggregate supply. a) Malaysia experiences a wave of immigration. b) Intel invents a new and more powerful computer chip. c) Tenaga Nasional Berhad (TNB) invests in new electricity transmission technology. d) A severe flood damages factories in Pahang.arrow_forwardAssume that the United States is currently in a recession. a. Draw a correctly labelled graph of aggregate demand and aggregate supply showing each of the following in the United States: i. Output level ii. Price level Aarrow_forward
- The imaginary country of Harris Island has the aggregate supply and aggregate demand curves as Table shows. Price Level: AD/AS Price Level AD AS 100 800 300 120 700 425 140 600 600 160 500 670 180 400 720 Plot the AD/AS diagram (You don't have to submit the plot, but I recommend doing it as it will help you with this problem). Identify the equilibrium. Blank #1 - Equilibrium Price Level Blank #2 - Equilibrium GDP Blank #3 - Would you expect unemployment in this economy to be relatively high or low? Blank #4 - Would you expect concern about inflation in this economy to be relatively high or low? Imagine that consumers begin to lose confidence about the state of the economy, and so AD becomes lower by 275 at every price level. Blank #5 - What is the new equilibrium GDP? Blank #6 - What is the new equilibrium Price Level? How will the shift in AD affect (answer is rise or fall)..arrow_forwardThe imaginary country of Harris Island has the aggregate supply and aggregate demand curves as Table shows. Price Level: AD/AS Price Level AD AS 100 800 300 120 700 425 140 600 600 160 500 670 180 400 720 Plot the AD/AS diagram (You don't have to submit the plot, but I recommend doing it as it will help you with this problem). Identify the equilibrium. Blank #1 - Equilibrium Price Level Blank #2 - Equilibrium GDP Blank #3 - Would you expect unemployment in this economy to be relatively high or low? Blank #4 - Would you expect concern about inflation in this economy to be relatively high or low? Imagine that consumers begin to lose confidence about the state of the economy, and so AD becomes lower by 275 at every price level. Blank #5 - What is the new equilibrium GDP? Blank #6 - What is the new equilibrium Price Level? How will the shift in AD affect (answer is rise or fall)... Blank #7 - the original output? Blank #8 - the price…arrow_forwardWhich of the following is not a component of the aggregate demand curve? a.Government spending(G) b. Investment (I) c. Consumption (C) d. net exports (X-M) e. Savingsarrow_forward
 Economics: Private and Public Choice (MindTap Cou...EconomicsISBN:9781305506725Author:James D. Gwartney, Richard L. Stroup, Russell S. Sobel, David A. MacphersonPublisher:Cengage Learning
 Macroeconomics: Private and Public Choice (MindTa...EconomicsISBN:9781305506756Author:James D. Gwartney, Richard L. Stroup, Russell S. Sobel, David A. MacphersonPublisher:Cengage Learning
 Economics (MindTap Course List)EconomicsISBN:9781337617383Author:Roger A. ArnoldPublisher:Cengage Learning
 Economics Today and Tomorrow, Student EditionEconomicsISBN:9780078747663Author:McGraw-HillPublisher:Glencoe/McGraw-Hill School Pub Co