
Concept explainers
Videos
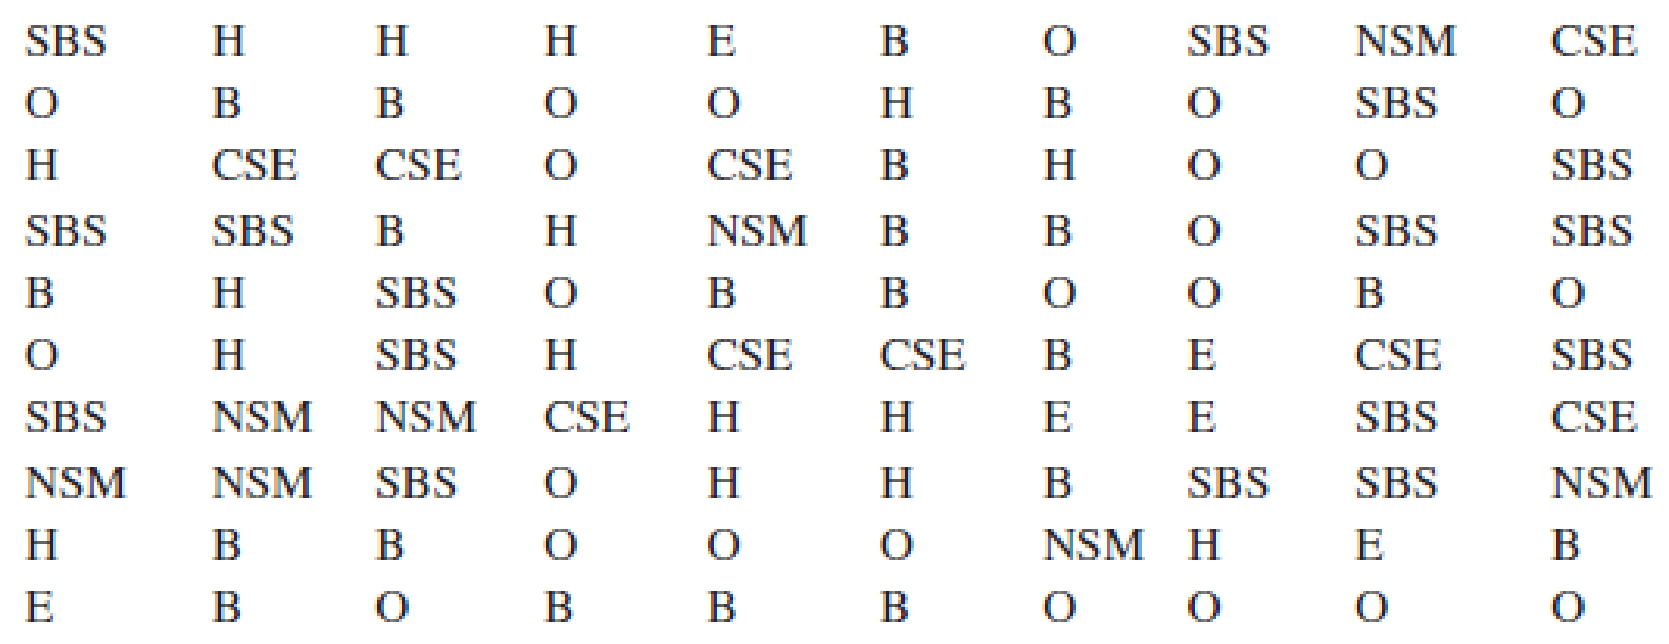
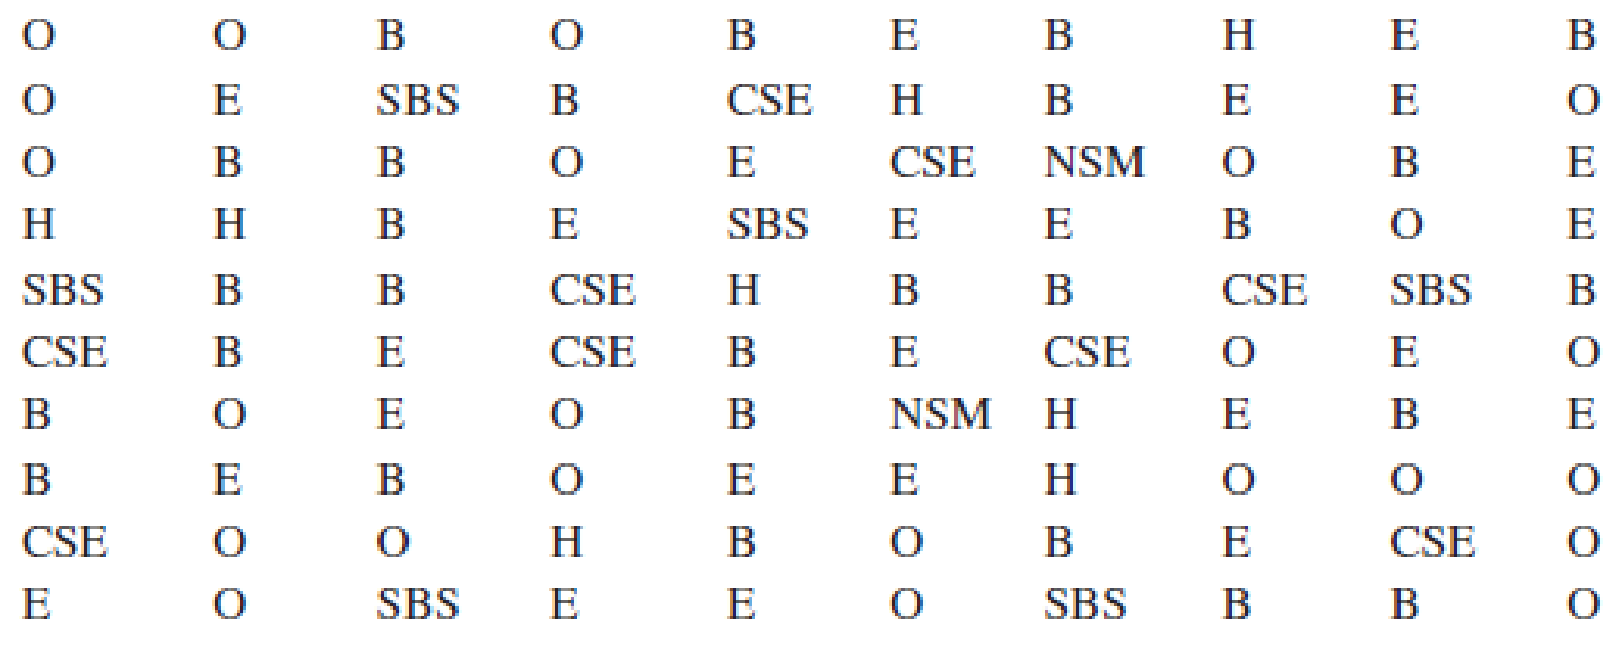
Degrees Awarded Annually. Nearly 1.9 million bachelor’s degrees and over 758,000 master’s degrees are awarded annually by U.S. postsecondary institutions as of 2018 (National Center for Education Statistics website). The Department of Education tracks the field of study for these graduates in the following categories: Business (B), Computer Sciences and Engineering (CSE), Education (E), Humanities (H), Natural Sciences and Mathematics (NSM), Social and Behavioral Sciences (SBS), and Other (O). Consider the following samples of 100 graduates:
Bachelor’s Degree Field of Study
Master’s Degree Field of Study
- a. Provide a percent frequency distribution of field of study for each degree.
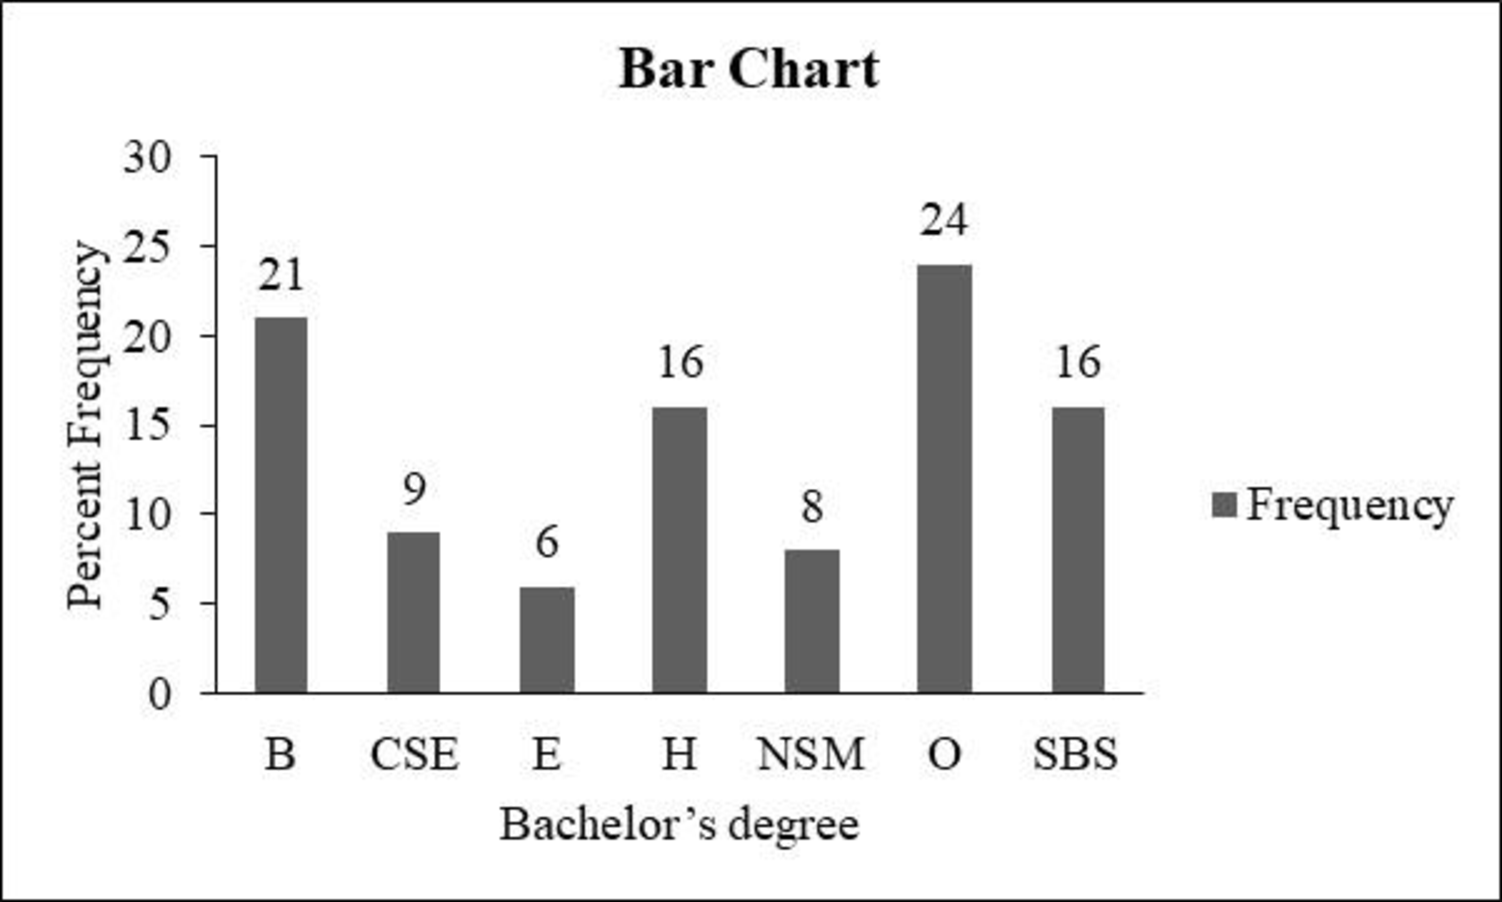
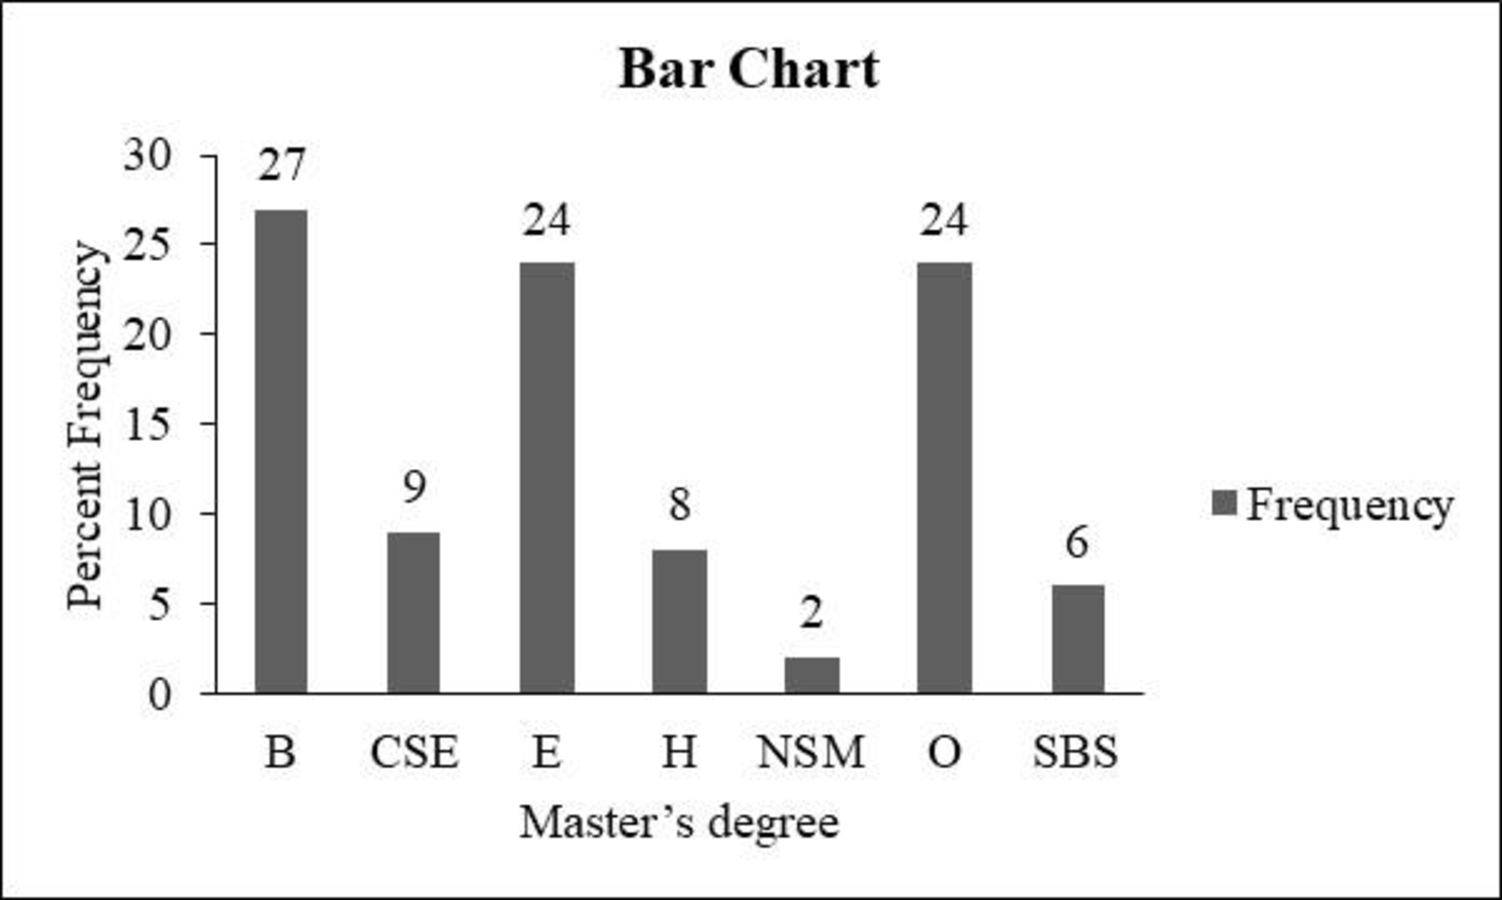
- b. Construct a bar chart for field of study for each degree.
- c. What is the lowest percentage field of study for each degree?
- d. What is the highest percentage field of study for each degree?
- e. Which field of study has the largest increase in percentage from bachelor’s to masters’?
a.
Construct the percent frequency distribution of the field of study for each degree.
Answer to Problem 9E
The percent frequency distribution for bachelor’s degree is given below:
| Bachelor’s degree | Percent frequency |
| B | 21% |
| CSE | 9% |
| E | 6% |
| H | 16% |
| NSM | 8% |
| O | 24% |
| SBS | 16% |
| Total | 100 |
The percent frequency distribution for master’s degree is given below:
| Master’s degree | Percent frequency |
| B | 27% |
| CSE | 9% |
| E | 24% |
| H | 8% |
| NSM | 2% |
| O | 24% |
| SBS | 6% |
| Total | 100 |
Explanation of Solution
Calculation:
The data represent the U.S postsecondary institutions that provide the annual awards for the 1.9 million bachelor’s degrees and the 758,000 master’s degrees. The graduate categories are Business (B), Computer science and Engineering (CSE), Education (E), Humanities (H), Natural sciences and Mathematics (NSM), Social and Behavioral sciences (SBS), and other (O).
For Bachelor’s degree:
Frequency:
The frequencies are calculated using the tally marks. Here, the number of times each class repeats is the frequency of that particular class.
Here, “B (business)” is the department type data, which is repeated 21 times in the data set, and thus, 21 is the frequency for the category “business (B)”.
Similarly, the frequency of the remaining types of network is given below:
| Bachelor’s degree | Tally | Frequency |
| B | 21 | |
| CSE | 9 | |
| E | 6 | |
| H | 16 | |
| NSM | 8 | |
| O | 24 | |
| SBS | 16 | |
| Total | 100 |
Relative frequency:
The general formula for the relative frequency is given below:
Therefore,
Similarly, the relative frequencies for the remaining types of class are obtained below:
| Bachelor’s degree | Frequency | Relative frequency |
| B | 21 | 0.21 |
| CSE | 9 | |
| E | 6 | |
| H | 16 | |
| NSM | 8 | |
| O | 24 | |
| SBS | 16 | |
| Total | 100 | 1.00 |
Percentage frequency distribution:
The general formula for the percent frequency is given below:
Therefore,
The percent frequencies for the remaining categories of education fields for bachelor degree are obtained below:
| Bachelor’s degree | Relative frequency | Percent frequency |
| B | 0.21 | 21% |
| CSE | 0.09 | |
| E | 0.06 | |
| H | 0.16 | |
| NSM | 0.08 | |
| O | 0.24 | |
| SBS | 0.16 | |
| Total | 1.00 | 100 |
For master’s degree:
Here, “B (business)” is the department type data, which is repeated 27 times in the data set, and thus, 27 is the frequency for the category “business (B)”.
Similarly, the frequency of the remaining types of department fields is given below:
| Master’s degree | Tally | Frequency |
| B | 27 | |
| CSE | 9 | |
| E | 24 | |
| H | 8 | |
| NSM | 2 | |
| O | 24 | |
| SBS | 6 | |
| Total | 100 |
Relative frequency:
Similarly, the relative frequencies for the remaining types of department fields are obtained below:
| Master’s degree | Frequency | Relative frequency |
| B | 27 | 0.27 |
| CSE | 9 | |
| E | 24 | |
| H | 8 | |
| NSM | 2 | |
| O | 24 | |
| SBS | 6 | |
| Total | 100 | 1.00 |
Percentage frequency distribution:
The percent frequencies for the remaining types of categories of education fields for master’s degree are obtained below:
| Master’s degree | Relative frequency | Percent frequency |
| B | 0.27 | 27% |
| CSE | 0.09 | |
| E | 0.24 | |
| H | 0.08 | |
| NSM | 0.02 | |
| O | 0.24 | |
| SBS | 0.06 | |
| Total | 1.00 | 100 |
b.
Construct the bar chart for each degree.
Answer to Problem 9E
Output obtained from Excel for bachelor’s degree is given below:
Output obtained from Excel for Master’s degree is given below:
Explanation of Solution
Calculation:
For Bachelor’s degree:
Software procedure:
Step-by-step procedure to draw the bar chart for bachelor’s degree using Excel:
- In Excel sheet, enter Bachelor’s degree in one column and Frequency in another column.
- Select the data and then choose Insert > Insert Column Bar Charts.
- Select Clustered Column Under More Column Charts.
- For master’s degree:
Software procedure:
Step-by-step procedure to draw the bar chart for master’s degree using Excel:
- In Excel sheet, enter Master’s degree in one column and Frequency in another column.
- Select the data and then choose Insert > Insert Column Bar Charts.
- Select Clustered Column Under More Column Charts.
c.
Find the lowest percentage field of study for each degree.
Answer to Problem 9E
The lowest percentage for a bachelor’ degree is Education.
The lowest percentage for a master’s degree is Natural sciences and Mathematics.
Explanation of Solution
For bachelor’ degree, the percentage for education is 6%, which is low when compared to the other categories.
For master’s degree, the percentage for Natural science and Mathematics is 2%, which is low when compared to other categories.
d.
Find the highest percentage field of study for each degree.
Answer to Problem 9E
The highest percentage field of study for a bachelor’ degree is Others.
The highest percentage field of study for a master’s degree is Business.
Explanation of Solution
For bachelor’ degree, the percentage for others is 24%, which is high when compared to the other categories.
For master’s degree, the percentage for business is 27%, which is high when compared to the other categories.
e.
Identify the field of study that has the largest increase in percentage from bachelor’s to masters’ degree.
Answer to Problem 9E
The field of study “Education” has the largest increase in percentage from bachelor’s to masters’ degree.
Explanation of Solution
Calculation:
In order to obtain the study field that has the largest increase in percentage from the bachelor’s to master’s degree, the difference between the two respective percentages should be found.
Therefore,
The differences between the two fields are tabulated below:
| Field | Bachelor’s | Master’s | Difference |
| B | 21% | 27% | 6% |
| CSE | 9% | 9% | 0% |
| E | 6% | 24% | 18% |
| H | 16% | 8% | 8% |
| NSM | 8% | 2% | 6% |
| O | 24% | 24% | 0% |
| SBS | 16% | 6% | 10% |
From the table, it is observed that the field of study “Education” has the largest increase in percentage from bachelor’s to master’s degree.
Want to see more full solutions like this?
Chapter 2 Solutions
Essentials Of Statistics For Business & Economics


- Oil ProductionThe following table shows the amount of crude oil in billions of barrels produced in the United States in recent years. Source: U.S. Energy Information Administration. Year Crude Oil Produced 2002 2.097 2003 2.060 2004 1.989 2005 1.893 2006 1.857 2007 1.853 2008 1.830 2009 1.954 2010 2.000 2011 2.063 2012 2.377 In this exercise we are interested in the total amount of crude oil produced over the 10-year period from mid-2002 to mid-2012, using the data for the 11 years above. One approach is to sum up the numbers in the second column, but only count half of the first and last numbers. Give the answer to this calculation. Approximate the amount of crude oil produced over the 10-year period 2002-2012 by taking the average of the left endpoint sum and the right endpoint sum. Explain why this is equivalent to the calculation done in part a. This is also equivalent to a formula known as the trapezoidal rule, discussed in the next chapter. If your calculator has a cubic regression feature, find the best-fitting cubic function for these data, letting t=0 correspond to 2000. Then integrate this equation over the interval [2.12] to estimate the amount of crude oil produced over this time period. Compare with your answer to part a.arrow_forwardCigarette Smokers The following table gives a recent estimate in millions of the smoking status among persons 25 years of the age and over their highest level of education. Source: National health interview survey. Education Current smoker Former smoker Non smoker Total Less than a high school diploma 7.90 6.66 14.12 28.68 High school diploma or GED 14.38 13.09 25.70 53.17 Some collage 12.41 13.55 28.65 54.61 Bachelors degree or higher 4.97 12.87 38.34 56.18 Total 39.66 46.17 106.81 192.64 a. Find the probability that a person is a current smoker. b. Find a probability that a person has less than a high school diploma. c. Find a probability that a person is a current smoker and has less than a high school diploma. d. Find the probability that a person is a current smoker, given that the person has less than a high school diploma. e. Are the events current smoker and less than a high school diploma independent events?arrow_forward
 Calculus For The Life SciencesCalculusISBN:9780321964038Author:GREENWELL, Raymond N., RITCHEY, Nathan P., Lial, Margaret L.Publisher:Pearson Addison Wesley,
 Linear Algebra: A Modern IntroductionAlgebraISBN:9781285463247Author:David PoolePublisher:Cengage Learning
 Glencoe Algebra 1, Student Edition, 9780079039897...AlgebraISBN:9780079039897Author:CarterPublisher:McGraw Hill
 Big Ideas Math A Bridge To Success Algebra 1: Stu...AlgebraISBN:9781680331141Author:HOUGHTON MIFFLIN HARCOURTPublisher:Houghton Mifflin Harcourt