
a.
To draw: A payoff and profit diagram to depict a straddle position when the exercise price is $130.
Introduction:
Straddle Strategy: It is one of the strategies used in manipulating the call and put options. In this strategy, the investor faces a position where the call option and the put option are placed in the same position with the same strike price (X) and time (t). In other words, a straddle is supposed to be the combined value of both the call option and the put option.
a.
Answer to Problem 16PS
We can conclude that an increase in price increased profit also.
Explanation of Solution
The information given to us is as follows:
| Statement showing the prices of the options in straddles and spreads | ||||||||
| Straddles and Spreads | ||||||||
| Stock prices | ||||||||
| Market Price | 116.5 | |||||||
| Market price | 130 | X110 Straddle | X120 Straddle | |||||
| Ending Stock price | Profit | Ending Stock price | Profit | |||||
| Buying options: | -15.4 | -24 | ||||||
| Strike | Price | Payoff | Profit | Return% | 50 | 24.6 | 50 | 36 |
| 110 | 22.8 | 20 | -2.8 | -12.28% | 60 | 14.6 | 60 | 26 |
| 120 | 16.8 | 10 | -6.8 | -40.48% | 70 | 4.6 | 70 | 16 |
| 130 | 13.6 | 0 | -13.6 | -100.00% | 80 | -5.4 | 80 | 6 |
| 140 | 10.3 | 0 | -10.3 | -100.00% | 90 | -15.4 | 90 | -4 |
| 100 | -25.4 | 100 | -14 | |||||
| Strike | Price | Payoff | Profit | Return% | 110 | -35.4 | 110 | -24 |
| 110 | 12.6 | 0 | -12.6 | -100% | 120 | -25.4 | 120 | -34 |
| 120 | 17.2 | 0 | -17.2 | -100% | 130 | -15.4 | 130 | -24 |
| 130 | 23.6 | 0 | -23.6 | -100% | 140 | -5.4 | 140 | -14 |
| 140 | 30.5 | 10 | -20.5 | -67.21% | 150 | 4.6 | 150 | -4 |
| 160 | 14.6 | 160 | 6 | |||||
| Straddle | Price | Payoff | Profit | Return% | 170 | 24.6 | 170 | 16 |
| 110 | 35.4 | 20 | -15.4 | -43.50% | 180 | 34.6 | 180 | 26 |
| 120 | 34 | 10 | -24 | -70.59% | 190 | 44.6 | 190 | 36 |
| 130 | 37.2 | 0 | -37.2 | -100% | 200 | 54.6 | 200 | 46 |
| 140 | 40.8 | 10 | -30.8 | -75.49% | 210 | 64.6 | 210 | 56 |
| Selling options: | ||||||||
| Call options | Price | Payoff | Profit | Return% | Ending | Bullish Spread | ||
| Stock price | 7.5 | |||||||
| 110 | 22.8 | -20 | 2.8 | 12.28% | 50 | -12.5 | ||
| 120 | 16.8 | -10 | 6.8 | 40.48% | 60 | -12.5 | ||
| 130 | 13.6 | 0 | 13.6 | 100.00% | 70 | -12.5 | ||
| 140 | 10.3 | 0 | 10.3 | 100.00% | 80 | -12.5 | ||
| 90 | -12.5 | |||||||
| Put options | Price | Payoff | Profit | Return% | 100 | -12.5 | ||
| 110 | 16.6 | 0 | 12.6 | 100.00% | 110 | -12.5 | ||
| 120 | 17.2 | 0 | 17.2 | 100.00% | 120 | -2.5 | ||
| 130 | 23.6 | 0 | 23.6 | 100.00% | 130 | 7.5 | ||
| 140 | 30.5 | 10 | 40.5 | 132.79% | 140 | 17.5 | ||
| 150 | 17.5 | |||||||
| Money spread | Price | Payoff | Profit | 160 | 17.5 | |||
| Bullish spread | 170 | 17.5 | ||||||
| Purchase of Call option at 110 | 22.8 | 20 | -2.8 | 180 | 17.5 | |||
| Selling of Call option at 140 | 10.3 | 0 | 10.3 | 190 | 17.5 | |||
| Combined profit | 20 | 7.5 | 200 | 17.5 | ||||
| 210 | 17.5 | |||||||
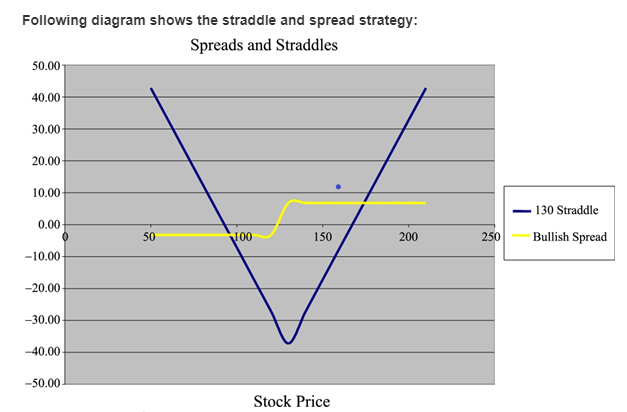
Let us use the same diagram for both the answers. Let us now understand the depiction of payoff and profit using a straddle strategy.
Like said before, in straddle strategy, both the call position and put position will be placed at the same place with the same strike price and expiration time. Let us observe the diagram. The blue shows the payoff and profit using a straddle strategy.
This diagram clears shows that when the price option of $110, the payoff is $20 and the net profit earned is $34.60. In a case where the price is $120, the profit earned is $44.60 and when the price rises to $130 the profit earned also rises to $54.60. Therefore, it means an increase in price increased profit also.
b.
To draw: A payoff and profit diagram to depict a bullish spread position when the exercise price is $120 and $130 assuming the excel position.
Introduction:
Bullish spread position: It is supposed to be a very optimistic option strategy. It is designed in such a way that profit can be earned even if there is a moderate increase in the price of the underlying asset.
b.
Answer to Problem 16PS
We can conclude that irrespective of a decline in market conditions, a net profit of $7.50 is earned.
Explanation of Solution
The information given to us is as follows:
| Statement showing the prices of the options in straddles and spreads | ||||||||
| Straddles and Spreads | ||||||||
| Stock prices | ||||||||
| Market Price | 116.5 | |||||||
| Market price | 130 | X110 Straddle | X120 Straddle | |||||
| Ending Stock price | Profit | Ending Stock price | Profit | |||||
| Buying options: | -15.4 | -24 | ||||||
| Strike | Price | Payoff | Profit | Return% | 50 | 24.6 | 50 | 36 |
| 110 | 22.8 | 20 | -2.8 | -12.28% | 60 | 14.6 | 60 | 26 |
| 120 | 16.8 | 10 | -6.8 | -40.48% | 70 | 4.6 | 70 | 16 |
| 130 | 13.6 | 0 | -13.6 | -100.00% | 80 | -5.4 | 80 | 6 |
| 140 | 10.3 | 0 | -10.3 | -100.00% | 90 | -15.4 | 90 | -4 |
| 100 | -25.4 | 100 | -14 | |||||
| Strike | Price | Payoff | Profit | Return% | 110 | -35.4 | 110 | -24 |
| 110 | 12.6 | 0 | -12.6 | -100% | 120 | -25.4 | 120 | -34 |
| 120 | 17.2 | 0 | -17.2 | -100% | 130 | -15.4 | 130 | -24 |
| 130 | 23.6 | 0 | -23.6 | -100% | 140 | -5.4 | 140 | -14 |
| 140 | 30.5 | 10 | -20.5 | -67.21% | 150 | 4.6 | 150 | -4 |
| 160 | 14.6 | 160 | 6 | |||||
| Straddle | Price | Payoff | Profit | Return% | 170 | 24.6 | 170 | 16 |
| 110 | 35.4 | 20 | -15.4 | -43.50% | 180 | 34.6 | 180 | 26 |
| 120 | 34 | 10 | -24 | -70.59% | 190 | 44.6 | 190 | 36 |
| 130 | 37.2 | 0 | -37.2 | -100% | 200 | 54.6 | 200 | 46 |
| 140 | 40.8 | 10 | -30.8 | -75.49% | 210 | 64.6 | 210 | 56 |
| Selling options: | ||||||||
| Call options | Price | Payoff | Profit | Return% | Ending | Bullish Spread | ||
| Stock price | 7.5 | |||||||
| 110 | 22.8 | -20 | 2.8 | 12.28% | 50 | -12.5 | ||
| 120 | 16.8 | -10 | 6.8 | 40.48% | 60 | -12.5 | ||
| 130 | 13.6 | 0 | 13.6 | 100.00% | 70 | -12.5 | ||
| 140 | 10.3 | 0 | 10.3 | 100.00% | 80 | -12.5 | ||
| 90 | -12.5 | |||||||
| Put options | Price | Payoff | Profit | Return% | 100 | -12.5 | ||
| 110 | 16.6 | 0 | 12.6 | 100.00% | 110 | -12.5 | ||
| 120 | 17.2 | 0 | 17.2 | 100.00% | 120 | -2.5 | ||
| 130 | 23.6 | 0 | 23.6 | 100.00% | 130 | 7.5 | ||
| 140 | 30.5 | 10 | 40.5 | 132.79% | 140 | 17.5 | ||
| 150 | 17.5 | |||||||
| Money spread | Price | Payoff | Profit | 160 | 17.5 | |||
| Bullish spread | 170 | 17.5 | ||||||
| Purchase of Call option at 110 | 22.8 | 20 | -2.8 | 180 | 17.5 | |||
| Selling of Call option at 140 | 10.3 | 0 | 10.3 | 190 | 17.5 | |||
| Combined profit | 20 | 7.5 | 200 | 17.5 | ||||
| 210 | 17.5 | |||||||

Let us use the same diagram for here also. Let us now understand the depiction of payoff and profit using a bullish spread strategy. The yellow line shown in the diagram depicts payoff and profit using a bullish spread strategy. When the diagram is observed, we find that when a call option is purchased at $110, the market is decreasing. When a call option is sold at $140, the net profit earned is $7.50. So, irrespective of a decline in market conditions, a net profit of $7.50 is earned.
Want to see more full solutions like this?
Chapter 20 Solutions
EBK INVESTMENTS

- Estimate the cost equation using the high-low method, and draw this line on your graph.arrow_forwardQuestions are shown in the first image, second image shows the T acct that is boank the first far left and far right side have the options shown, the last row has bal. as the option on both sides, the second column next to it is missing a title options are accts payable, cash or supplies expensearrow_forwardI'm working through a practice assignment with an answer key and I'm getting Answer A for question 4 but the answer key for this one says the answer is C. Can someone work through this one and show me how its done please? For questions 3-4, consider the following table. Investment Investment cost at i = 0 Revenue at t = 1 Revenue at t= 3. 180 200 -200 50 -300 149 Table 1 Suppose that you need to choose between two investment options A and B. Given that the persistent anmual interest rate is 5 percent, which investment option would yiel a higher value? (a) Option A. (b) Option B. (c) Both options would yield the same value. (d) Not enough information.arrow_forward
- Please note: You can draw your trees either by hand on paper or in Excel. If you do it on a paper, please take a picture of the tree and insert it in your solution file. You can submit your solution as an Excel file or Word document. In either case, your solution should contain your decision trees and all necessary calculations (not just the results of calculations). Problem 1. The WHN Company Problem. The WHN Company is going to introduce one of the three new products: a widget, a hummer, or a nimnot. The market condition could be favorable, stable, or unfavorable with the probabilities 0.2, 0.5, and 0.3 respectively. The monetary outcomes for each product under each condition are described in the following table: Unfavorable $120,000 $70,000 -875,000 $40,000 $20,000 $30,000 $30,000 Favorable Stable Widget Hummer $60,000 Nimnot $35,000 Create a decision tree to identify which new product should be introduced in order to maximize the company's profit?arrow_forwardFind an expression for the marginal revenue function, simplify it, and record your result in the box below. Be sure to use the proper variable in your answer. (Use the preview button to check your syntax before submitting your answer.) Answer: MR(g)arrow_forwardApplying the DDM model utilizing the following inputs: PO, d1, d2, r, g. When rearranging the price expression so that we can solve for g, g= r - d2/((PO*(1+r)-d1)) True Falsearrow_forward
- Using the data in E4-2 and spreadsheet software, determine: The variable cost per unit, the total fixed cost, and R2. The plotted data points using the graphing function. Compare the results to your solutions in E4-2 and E4-3 and explain the reasons for the results.arrow_forwardWrite a paragraph on each of the following topics: liquidity, asset management, debt management and profitability. Be sure to label these separately. Analyze each topic using the answers from your ratios to support your analysis by deciphering what they are telling you. Create a text box (Insert Menu, click on the “Text” button on the right side of the menu bar, and choose, “Text box”. Then click and drag a box to write in.arrow_forwardBriefly explain the concept of economic, profitmaximizing pricing. It may be helpful to use graphs in your explanation.arrow_forward
- If the MARR = 12%, which server should be selected? Use the PW to make the selection. You may use excel for your analysis.arrow_forwardDirections: Read the following sentences. Write the letter “T” if the statement is True and “F” if the statement is False. Write your answer on the space before the number. You may view this test at our google class. __________4. LCNRV should always be equal to net realizable value. __________5. Lower of cost and net realizable value gives the lowest valuation if applied to individual item of inventory. __________6. The amount of any writedown of inventory to net realizable value and all losses of inventory should be recognized as operating expense in the period the writedown or loss occurs. __________7. Professional fee arising directly from the acquisition of property and equipment are recognized as expense immediately. __________8. Exchange has a commercial substance when the exchange result in the difference in future cash flows. __________9. The cost of abnormal amounts of wasted materials is not included in the cost of self-constructed assets. __________10. An asset is not…arrow_forwardDirections: Read the following sentences. Write the letter “T” if the statement is True and “F” if the statement is False. Write your answer on the space before the number. You may view this test at our google class. __________4. LCNRV should always be equal to net realizable value. __________5. Lower of cost and net realizable value gives the lowest valuation if applied to individual item of inventory. __________6. The amount of any writedown of inventory to net realizable value and all losses of inventory should be recognized as operating expense in the period the writedown or loss occurs. __________7. Professional fee arising directly from the acquisition of property and equipment are recognized as expense immediatelyarrow_forward
 Principles of Cost AccountingAccountingISBN:9781305087408Author:Edward J. Vanderbeck, Maria R. MitchellPublisher:Cengage Learning
 Essentials Of Business AnalyticsStatisticsISBN:9781285187273Author:Camm, Jeff.Publisher:Cengage Learning,
 Essentials of Business Analytics (MindTap Course ...StatisticsISBN:9781305627734Author:Jeffrey D. Camm, James J. Cochran, Michael J. Fry, Jeffrey W. Ohlmann, David R. AndersonPublisher:Cengage Learning
 Principles of Accounting Volume 2AccountingISBN:9781947172609Author:OpenStaxPublisher:OpenStax College