Concept explainers
Videos
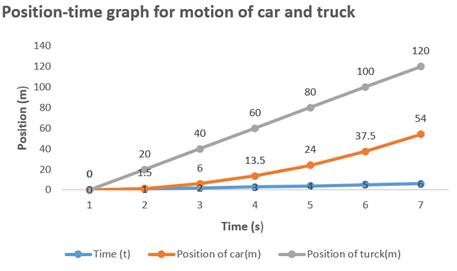
The position time graph for the car and truck for time
Explanation of Solution
Given info:
Car is at rest at time
Car is accelerating constantly at
At time
Formula used:
Formula to find the distance travelled in term of velocity and time is,
Another formula to find the distance travelled in term of speed and acceleration is,
Here,
To draw a position versus time graph we have to draw a table showing position of car from time
Find the position of car:
As car is starting from rest its initial velocity is zero. Finding the position of car using equation-2.
By changing the value of time in equation-3 from
| Time | |||||||
| Position of car ( ) |
Find the position of truck using equation-1.
By changing the value of time in equation-4 from
| Time | |||||||
| Position of car ( ) |
We draw position time graph by taking value of time on x-axis and position on y-axis.
The shape of position time graph for car is curve and for truck is a straight line.
Graph shows car is accreting from rest and truck is moving with constant velocity.
Conclusion:
Thus,the shape of position time graph for car is curve and for truck is straight line.
Graph shows car is accreting from rest and truck is moving with constant velocity.
Want to see more full solutions like this?
Chapter 2 Solutions
COLLEGE PHYSICS


- • 4. An object's position is described by the following polynomial for O s to 10 s. S (t) = t3 - 15 t2 + 54 t where Sin meters, %3D t is in seconds. Determine : a) The object's Velocity Function3; b) The object's acceleration Function; c) The object's position at, t = 4 s; d) The object's velocity at, t = 4 s; %3D e) The object's acceleration at t = 4s; f) The time and velocity when object returns to its original position; g) The time and velocity when acceleration is zero. h) Is the object's speed is increasing, decreasing, either if time is 4 s ? - NOTES E UELDIMDDOVE OFFICEarrow_forwardProblems • 1. A motorcycle stunt rider rides off the edge of a cliff. Just at the edge his velocity is horizontal with magnitude 5.0 m/s. Find the rider velocity and position after 1/4seconds.arrow_forward•A soccer ball is kicked with an initial speed of 8.25 m>s. After0.750 s it is at its highest point. What was its initial direction ofmotion?arrow_forward
- 81. •Astro The froghopper, a tiny insect, is a remarkable jumper. Suppose you raised a colony of the little critters on the Moon, where the acceleration due to gravity is only 1.62 m/s?. If on Earth a froghopper's maximum height is b and maximum horizontal range is R, what would its maximum height and range be on the Moon in terms of h and R? Assume a froghopper's takeoff speced is the same on the Moon and on Earth.arrow_forwardMotorist A, starting from rest, accelerates at a rate of 6 ft/sec²• Atthe same time that A begins, motorist B, starting from rest at a point 100 ftahead of A, accelerates at a rate of 4 ft/sec² • (a) How far does motorist A travelbefore they meet? (b) At the instant they meet each motorist decelerates at therate of 5 ft/sec² until his car comes to rest. How far apart are they when theyhave stopped?arrow_forwardA Lockheed Martin F-35 II lighting jet takes off from an aircraft carrier with a runway length of 90 m and a takeoff speed 70 m/s at the end of the runway. Jets are catapulted into airspace from the deck of an aircraft carrier with two sources of propulsion: the jet propulsion and the catapult. At the point of leaving the deck of the aircraft carrier, the F-35’s acceleration decreases to a constant acceleration of 5.0m/s2 at 30 with respect to the horizontal. (a) What is the initial acceleration of the F-35 on the deck of the aircraft carrier to make it airborne? (b) Write the position and velocity of the F-35 in unit vector notation from the point it leaves the deck of the aircraft carrier. (c) At what altitude is the fighter 5.0 s after it leaves the deck of the aircraft carrier? (d) What is its velocity and speed at this time? (e) How far has it traveled horizontally?arrow_forward
- Is it possible for velocity to be constant while acceleration is not zero? Explain.arrow_forwardA celebrated Mark Twain story has motivated contestants in the Calaveras County Jumping Frog Jubilee, where frog jumps as long as 2.2 m have been recorded. If a frog jumps 2.2 m and the launch angle is 45, find (a) the frogs launch speed and (b) the time the frog spends in the air. Ignore air resistance.arrow_forwardThere is a distinction between average speed and the magnitude of average velocity. Give an example fiat illustrates the difference between these two quantities.arrow_forward
- A)What is the height H of the cliff in m? Part (b) What is the maximum height reached by the arrow along its trajectory in meters? •Part (c) What is the arrow's speed just before hitting the cliff in m/s?arrow_forward• 2. A piece of stone was thrown straight upward with a speed of 20.0 m/s. it was caught on its way down at a point 5 m above where it was thrown. A) How fast was it going when it was caught? B) How long did the trip take? Jaya Update Availablearrow_forward• Part A Gulls are often observed dropping clams and other shellfish from a height to the rocks below, as a means of opening the shells. If a seagull drops a shell from rest at a height of 13 m, how fast is the shell moving when it hits the rocks? Express your answer using two significant figures. ? m/s Submit Request Answer Provide Feedback Next >arrow_forward
 Principles of Physics: A Calculus-Based TextPhysicsISBN:9781133104261Author:Raymond A. Serway, John W. JewettPublisher:Cengage Learning
 College PhysicsPhysicsISBN:9781305952300Author:Raymond A. Serway, Chris VuillePublisher:Cengage Learning
 University Physics Volume 1PhysicsISBN:9781938168277Author:William Moebs, Samuel J. Ling, Jeff SannyPublisher:OpenStax - Rice University
 College PhysicsPhysicsISBN:9781938168000Author:Paul Peter Urone, Roger HinrichsPublisher:OpenStax College