
Essentials Of Business Analytics
1st Edition
ISBN: 9781285187273
Author: Camm, Jeff.
Publisher: Cengage Learning,
expand_more
expand_more
format_list_bulleted
Concept explainers
Videos
Textbook Question
Chapter 2, Problem 2P
The following table contains a partial list of countries, the continents on which they are located, and their respective gross domestic products (GDP) in U.S. dollars. A list of 125 countries and their GDPs is contained in the file GDPlist.
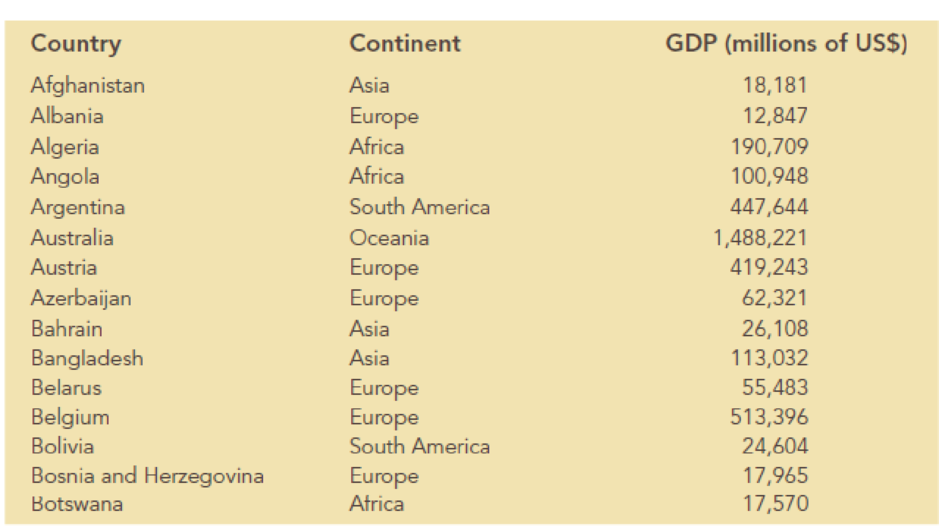
- a. Sort the countries in GDPlist from largest to smallest GDP. What are the top 10 countries according to GDP?
- b. Filter the countries to display only the countries located in Africa. What are the top 5 countries located in Africa according to GDP?
- c. What are the top 5 countries by GDP that are located in Europe?
Expert Solution & Answer
Want to see the full answer?
Check out a sample textbook solution
Students have asked these similar questions
Many countries, especially those in Europe, have significant gold holdings. But many of these countries also have massive debts. The following data show the total value of gold holdings in billions of U.S. dollars and the debt as a percentage of the gross domestic product for nine countries (WordPress and Trading Economics websites, February 24, 2012). Click on the datafile logo to reference the data.
Country
Gold Value
Debt
China
63
17.7
France
146
81.7
Germany
203
83.2
Indonesia
33
69.2
Italy
147
119
Netherlands
36
63.7
Russia
50
9.9
Switzerland
62
55
U.S.
487
93.2
Using the entire data set, develop the estimated regression equation that can be used to predict the debt of a country given the total value of its gold holdings.
y^ = (to 4 decimals) (to 4 decimals) Gold Value
Suppose that after looking at the scatter diagram in part (a) that you were able to visually identify what appears to be an…
The results of a search to find the least expensive round-trip flights to Atlanta and Salt Lake C
major U.S. cities are shown in the following table. The departure date was June 20, 2012 and
was June 27, 2012. Click on the datafile logo to reference the data,
DATA file
Round-Trip Cost ($)
Departure City
Atlanta
Salt Lake Cit
Cincinnati
New York
340.10
321.60
291.60
570.10
354.60
465.60
Chicago
Dae
210/O
This chart displays the average rate of people living in poverty in the 23 continental states west of the Mississippi River for the years 2014 – 2016. Create a stemplot for these data. Note that a stemplot never shows the decimal symbol and only the rightmost digit is used for the leaf. (https://www.census.gov/data/tables/2017/demo/income-poverty/p60-259.html) Average rate of people living in poverty in the 23 continental states west of the Mississippi River for the years 2014 – 2016
State
Rate of Poverty (%)
Minnesota
8.3
Utah
9.4
Iowa
10.1
Wyoming
10.1
Colorado
10.2
North Dakota
10.5
Nebraska
10.6
Missouri
11.1
Washington
11.5
Idaho
11.9
Montana
11.9
Kansas
12.5
Oregon
12.7
Nevada
13.4
South Dakota
13.7
California
14.5
Texas
15.0
Oklahoma
15.4
Arkansas
16.8
Arizona
18.2
New Mexico
19.1
Louisiana
20.6
Mississippi
20.8
Chapter 2 Solutions
Essentials Of Business Analytics
Ch. 2 - A Wall Street Journal subscriber survey asked 46...Ch. 2 - The following table contains a partial list of...Ch. 2 - Ohio Logistics manages the logistical activities...Ch. 2 - A partial relative frequency distribution is...Ch. 2 - In a recent report, the top five syndicated...Ch. 2 - In a study of how chief executive officers (CEOs)...Ch. 2 - Consumer complaints are frequently reported to the...Ch. 2 - Reports have found that many U.S. adults would...Ch. 2 - Consider the following data: a. Develop a...Ch. 2 - Consider the following frequency distribution....
Ch. 2 - The owner of an automobile repair shop studied the...Ch. 2 - Approximately 1.65 million high school students...Ch. 2 - Consider a sample with data values of 10, 20, 12,...Ch. 2 - Consider a sample with data values of 27, 25, 20,...Ch. 2 - Consider a sample with data values of 53, 55, 70,...Ch. 2 - If an asset declines in value from 5,000 to 3,500...Ch. 2 - Suppose that you initially invested 10,000 in the...Ch. 2 - The average time that Americans commute to work is...Ch. 2 - Suppose that the average waiting time for a...Ch. 2 - According to the National Education Association...Ch. 2 - Return to the waiting times given for the...Ch. 2 - The results of a national survey showed that on...Ch. 2 - Suppose that the national average for the math...Ch. 2 - Five observations taken for two variables follow....Ch. 2 - The scatter chart in the following figure was...Ch. 2 - The economic downturn in 20082009 resulted in the...Ch. 2 - Heavenly Chocolates manufactures and sells quality...
Knowledge Booster


Learn more about
Need a deep-dive on the concept behind this application? Look no further. Learn more about this topic, statistics and related others by exploring similar questions and additional content below.Similar questions
- Label the columns of the table of the World Bank, four income groups 2017? Low income 31 Lower middle income 56 Upper middle income 54 High income 53arrow_forwardfind population sd 12,15,18,16,19,22,23,25,28arrow_forwardThe Current Results website lists the average annual high and low temperatures (degreesfahrenheit) and average annual snowfall (inches) for fifty-one major U.S. cities, based ondata from 1981 to 2010. The data are contained in the file Snow. for example, the average low temperature for Columbus, Ohio is 44 degrees and the average annual snowfallis 27.5 inches.a. Construct a scatter diagram with the average annual low temperature on the horizontalaxis and the average annual snowfall on the vertical axisarrow_forward
- Each year Money magazine publishes a list of "Best Places to Live in the United States." These listings are based on affordability, educational performance, convenience, safety, and livability. The list below shows the median household income of Money magazine's top city in each U.S. state for 2017.† City Median HouseholdIncome ($) City Median HouseholdIncome ($) Pelham, AL 66,772 Bozeman, MT 49,303 Juneau, AK 84,101 Papillion, NE 79,131 Paradise Valley, AZ 138,192 Sparks, NV 54,230 Fayetteville, AR 40,835 Nashua, NH 66,872 Monterey Park, CA 57,419 North Arlington, NJ 73,885 Lone Tree, CO 116,761 Rio Rancho, NM 58,982 Manchester, CT 64,828 Valley Stream, NY 88,693 Hockessin, DE 115,124 Concord, NC 54,579 St. Augustine, FL 47,748 Dickinson, ND 71,866 Vinings, GA 73,103 Wooster, OH 43,054 Kapaa, HI 62,546 Mustang, OK 66,714 Meridian, ID 62,899 Beaverton, OR 58,785 Schaumburg, IL 73,824 Lower Merion, PA 117,438 Fishers, IN 87,043 Warwick, RI 63,414 Council…arrow_forwardOn the basis of a population survey, there were 84.4 million males and 98.2 million females 25 years old or older in a certain country. The educational attainment of the males and females is shown in the accompanying table. Complete parts (a) through (d) below.arrow_forwardMany countries, especially those in Europe, have significant gold holdings. But many of these countries also have massive debts. The following data show the total value of gold holdings in billions of U.S. dollars and the debt as a percentage of the gross domestic product for nine countries (WordPress and Trading Economics websites, February 24, 2012). Country Gold Value Debt China 63 17.7 France 146 81.7 Germany 203 83.2 Indonesia 33 69.2 Italy 147 119 Netherlands 36 63.7 Russia 50 9.9 Switzerland 62 55 U.S. 487 93.2 Suppose that after looking at the scatter diagram in part (a) that you were able to visually identify what appears to be an influential observation. Drop this observation from the data set and fit an estimated regression equation to the remaining data. Y^ =arrow_forward
- Many countries, especially those in Europe, have significant gold holdings. But many of these countries also have massive debts. The following data show the total value of gold holdings in billions of U.S. dollars and the debt as a percentage of the gross domestic product for nine countries (WordPress and Trading Economics websites, February 24, 2012). Country Gold Value Debt China 63 17.7 France 146 81.7 Germany 203 83.2 Indonesia 33 69.2 Italy 147 119 Netherlands 36 63.7 Russia 50 9.9 Switzerland 62 55 U.S. 487 93.2 Select for the total value of a country's gold holdings ($ billions) as the independent variable in a scatter diagram. Using the entire data set, develop the estimated regression equation that can be used to predict the debt of a country given the total value of its gold holdings. ^y = ___ (to 4 decimals) + ___ ( to 4 decimals). Gold Value Suppose that after looking at the scatter…arrow_forwardThis table shows total motor vehicle registrations and total populations in 2018 for selected states. State California New Hampshire New York Population (in millions) 39.6 1.4 19.5 Motor Vehicle Registrations (in millions) 31.0 1.3 11.5arrow_forwardA real estate major collected information on some recent local home sales. The first 6 lines of the database appear in the accompanying table. The columns correspond to the house identification number, the community name, the zip code, the number of acres of the property, the year the house was built, the market value, and the size of the living area (in square feet). Do the data appear to have come from a designed survey or experiment? What concerns might you have about drawing conclusions from this data set? E Click the icon to view the data table. Do the data appear to have come from a designed survey or experiment? O A. It is not clear if the data were obtained from an experiment. They are certainly not from a survey. O B. It is not clear if the data were obtained from a survey. They are certainly not from an experiment. O C. It is not clear if the data were obtained from a survey or an experiment. O D. The data were certainly not obtained from survey or an experiment. What…arrow_forward
- B please. Table includedarrow_forwardThe average monthly residential gas bill for Black Hills Energy customers in Cheyenne, Wyoming is (Wyoming Public Service Commission website). How is the average monthly gas bill for a Cheyenne residence related to the square footage, number of rooms, and age of the residence? The following data show the average monthly gas bill for last year, square footage, number of rooms, and age for typical Cheyenne residences. Average Monthly Gas Number of Bill for Last Year Age Square Footage Rooms $70.20 16 2537 6 $81.33 2 3437 8 $45.86 27 976 6 $59.21 11 1713 7 $117.88 16 3979 11 $57.78 2 1328 7 $47.01 27 1251 6 $52.89 4 827 5 $32.90 12 645 4 $67.04 29 2849 5 $76.76 1 2392 7 $60.40 26 900 5 $44.07 14 1386 5 $26.68 20 1299 4 $62.70 17 1441 6 $45.37 13 562 4 $38.09 10 2140 4 $45.31 22 908 6 $52.45 24 1568 5 $96.11 27 1140 10…arrow_forward
arrow_back_ios
arrow_forward_ios
Recommended textbooks for you
 Glencoe Algebra 1, Student Edition, 9780079039897...AlgebraISBN:9780079039897Author:CarterPublisher:McGraw Hill
 Algebra: Structure And Method, Book 1AlgebraISBN:9780395977224Author:Richard G. Brown, Mary P. Dolciani, Robert H. Sorgenfrey, William L. ColePublisher:McDougal Littell
Glencoe Algebra 1, Student Edition, 9780079039897...
Algebra
ISBN:9780079039897
Author:Carter
Publisher:McGraw Hill
Algebra: Structure And Method, Book 1
Algebra
ISBN:9780395977224
Author:Richard G. Brown, Mary P. Dolciani, Robert H. Sorgenfrey, William L. Cole
Publisher:McDougal Littell
Find number of persons in a part with 66 handshakes Combinations; Author: Anil Kumar;https://www.youtube.com/watch?v=33TgLi-wp3E;License: Standard YouTube License, CC-BY
Discrete Math 6.3.1 Permutations and Combinations; Author: Kimberly Brehm;https://www.youtube.com/watch?v=J1m9sB5XZQc;License: Standard YouTube License, CC-BY
How to use permutations and combinations; Author: Mario's Math Tutoring;https://www.youtube.com/watch?v=NEGxh_D7yKU;License: Standard YouTube License, CC-BY
Permutations and Combinations | Counting | Don't Memorise; Author: Don't Memorise;https://www.youtube.com/watch?v=0NAASclUm4k;License: Standard Youtube License
Permutations and Combinations Tutorial; Author: The Organic Chemistry Tutor;https://www.youtube.com/watch?v=XJnIdRXUi7A;License: Standard YouTube License, CC-BY